Review of Professional Management

 Search
1 Department of Economics, Kurukshetra University, Kurukshetra, Haryana, India

Creative Commons Non Commercial CC BY-NC: This article is distributed under the terms of the Creative Commons Attribution-NonCommercial 4.0 License (http://www.creativecommons.org/licenses/by-nc/4.0/) which permits non-Commercial use, reproduction and distribution of the work without further permission provided the original work is attributed.
The main objective of public transport is to convey more people in much less space than individual automobiles and help in reducing traffic congestion as well as air pollution from vehicles. It also relieves riders of the stress that come from daily driving in congested areas. The present study took a case study of SRTUs (State Road Transport Undertakings) of Haryana Roadways and found out which factors affect their performance during study periods. It also analyses the performance of traffic and accidents rate in the state. To evaluate the physical and financial performance of the Haryana Roadways LGR (Linear growth rate) and ordinary least square techniques are adopted and the annual average growth of each variable during 2009–2010 to 2017–2018 with the help of SPSS is found. In the financial aspect, the result reveals that Haryana Roadways goes running into a loss environment. The physical aspects revealed that fleet utilisation, vehicle utilisation, or load factor are decreased and negatively affect the physical performance of Haryana Roadways, but Staff productivity or effective kilometre per day contributes to a positive trend. The findings suggest that appropriate policy initiatives or operational research are required for these undertakings to be transformed into profit-making SRTUs in India.
Haryana roadways, public transport, physical and financial performance
Introduction
The State Road Transport Undertaking (SRTUs) is a bus-based public transport under the Road Transport Act 1950. It has been providing bus services to passengers in rural, urban, and inter-city India. The SRTUs in India are managed into four different patterns of management, which are under the following—(a) Department management (under central or state government); (b) State road transport corporation; (c) Government company; and (d) Municipal form (Bell et al., 1983). The present study takes the case study of Haryana Roadways to analyse the performance of SRTUs. Haryana state provides the public bus services under the state government transport department (Government of Haryana, 2019b).
In 1966, Haryana Roadways became the public state transport of the Government of Haryana in India (Government of Haryana, 2018). It is a major part of the Transport Department of Haryana, which provides better, efficient, cheap, or affordable passenger services within the state or neighbouring states. The Director-General of State Transport is responsible for providing well-managed or coordinated, economical, safe, and efficient transportation services to the public in the state. Haryana Roadways’ progress is reflected better based on some indicators like average ages of buses, vehicles, and staff; effective kilometre operated; decreased accident rate; and fuel efficiency (Government of Haryana, 2019a). According to the Transport Department record, Haryana Roadways has a fleet of about 4,104 (buses) operated under 24 depots and 13 sub depots, which carried approx. 10.85 Lacs passengers per day. In this staff strength is 16,433, daily kilometre operated by buses is 11.82 lacs, the annual turnover is 1,906 crore. The central workshops Haryana Roadways Engineering Corporation (HREC) designs, manufactures, and manages bus bodies (Government of Haryana, 2019c). In Haryana Roadways 24 Bus Stands namely are Ambala, Bhiwani, Jind, Jhajjar, Hisar, Faridabad, Fatehabad, Gurugram, Kaithal, Karnal, Kurukshetra, Mahendragarh, Panipat, Panchkula, Rohtak, Rewari, Sonipat, Sirsa, Yamunanagar, Delhi, Chandigarh, Charkhi Dadri, Mewat (Nuh) and Palwal.
Haryana Roadways also adopted more new initiatives to provide amenities to the passenger by introducing the ‘Haryana Gaurav’ bus with deluxe facilities and ordinary fare, which is mainly known as ‘Aam Aadmi Ki Khas Bus’ about 200 buses operating on different routes. New Volvo AC bus service ‘Saarthi’ has been introduced on the Chandigarh–Delhi–Gurugram or Chandigarh–Delhi–Faridabad routes, and so on, or CNG bus service ‘Haryana Uday’ in the National Capital Region (NCR) of New Delhi. Haryana Roadways won the ‘Better Transport Utility’ title from the Association of State Road Transport Undertakings (ASRTU) in India (Government of Haryana, 2018).
Before the road transportation act 1950, bus services were provided by the private sector. After that in 1965 state road transport undertakings (SRTUs) came into existence and took command of bus services facilitator through public transport over the country with state-oriented authority.
Table 1 represents data on SRTUs’ progress in various indicators from 1960 to 2017. In which SRTUs no., employment or buses held increased continuously. Here, SRTU’s role in traffic handling also increased from 26 billion passenger kms in 1960–1961 to 566 billion passenger kms in 2016–2017, which shows the efficiency and importance of public transport in congested areas and traffic management.
Table 1. Progress of SRTUs in India.
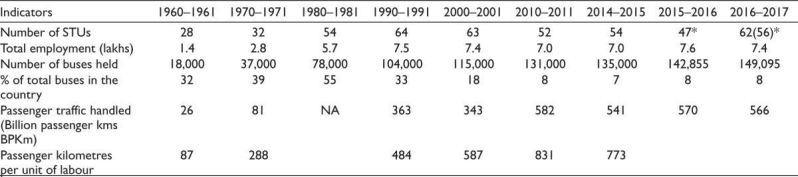 Source: Review of the Performance of State Road Transport Undertakings 2017; Government of India (2017).
Note: * Number of SRTUs examined in the Report.
The main objective of this study is to analyse the factors that affect the physical and financial performance of Haryana Roadways SRTUs in India. The study also shows the accident rate, road safety status, and profit analysis of SRTUs. Only a few studies are available that analyse the performance of SRTUs in systematic ways, that is, SWOT analysis of UPSRTC (Devi, 2015). This study contributes to an existing review of the literature on this particular problem. The survey is necessary because of the current issue of the privatisation of public transportation under the PPP model (public–private partnership) to strengthen transportation infrastructure, handle rapidly increasing population and migration in metropolitan cities, and bear long-term financial constraints. This study will assist the operator by analysing the undertaking’s performance and, as a result, improving its management and economic condition. The study also provides some suggestions for further improvement based on existing research done by field experts and well-known organisations.
Review of Literature
Here, the literature review evaluates the empirical analysis of transport undertakings and specifically public transport providers and their performance evaluating techniques which clearly mentioned the affecting variables of physical and financial aspects like fleet utilisation, load factor, expenditure or revenue, and so on. A few studies have been conducted at the regional, national, and international levels by researchers, academicians, planners, and private institutions on the perspectives of performance evaluation of public passenger transport undertakings. The results of relevant studies are the following.
In the series of literature, Perry and Babitsky (1986) described the cost and benefits of privatisation in the context of urban bus transit in New York–New Jersey areas during 1980–1981 while using secondary data which reported that privately owned or managed transit system performed significantly better on output per dollar than four other types of organisations but contract managed system was not more efficient than publicly managed system with regard to output per dollar and vehicle or maintains efficiency. The researcher also suggests that organisation form reflects an increase in upper and middle management with respect to transportation.
In their research paper Vijayaraghavan (1995) examines the strength and weaknesses of SRTUs, through a questionnaire of 20 respondents in India. The observed data revealed that the major weaknesses are lack of marketing approach and involvement of the private sector in passenger transport and besides that good strategic management approach is needed for better performance.
Alexanderssson et al. (1997) studied the cost-effectiveness of tendering with pool time–services data of 168 observations in Sweden during 1987 to 1993. They subject local and regional bus services to competitive bidding, which changes the market structure and increases seller concentration for both private and state-owned companies. Companies gaining from the municipally owned companies and deregulated (Private) Swedish bus services attain gain. Sriraman’s (1999) study found that the recovery cost ratio, load factors, and private sectors impose adverse effects on the SRTUs. The study also suggested that the recovery cost rises due to increased load factor system (LFS) and fare in urban-based SRTUs as compared to rural SRTUs or city-based SRTUs. Singh (2000) analysed the growth rate and level of total factor productivity (TFP) of 21 STUs in India for the period 1983–1984 to 1996–1997 using the Index Number Approach based on secondary data. The study reveals that the major productive STUs is Pattukkuttottai Azagiri Transport corporation Limited (PATC) or least is Bombay Electricity Supply and Transport Undertaking (BEST) and also finds the TFP difference due to managerial efficiency of STUs. TFP was positively related to output and load factor.
Pucher et al. (2005) examined the public transport reform of Seoul in 2004 and throughout it restructured the bus system addressing the network of Bus Rapid Transport (BRT) route the schedule with median bus lane and the semi-operating system, improved bus services, and better coordinated with the metro rail system, which improved the performance of Seoul’s Public Transport system. Here another study of Kaur and Kaur (2012) analysed the growth in numbers of buses held by Punjab Roadways, Pepsu Road Transport Corporation (PRTC), and the private sector in Punjab state during 1999–2000 to 2009–2010 through data ratio analysis (DRA) technique. The study found that the share of Punjab roadways has declined and private operators share are increasing with passenger demand. Arora (2016) analysed the how positive correlation between customer satisfaction and employee satisfaction affects organisation success based on Primary data in the form of questionnaires through Principal Component Analysis tools with SPSS in 5 districts namely Ambala, Hisar, Rewari, Panipat, and Rohtak in Haryana state. Jain and Dhiman (2018) examines how the performance of state road transport has declined due to increasing competition with private corporations, changing behaviour, or the demand of consumers for public transport in Haryana Roadways. They also suggested the use of Simon’s four-level model to implement in a control system for better performance analysis.
Useche et al. (2018) analysed the correlation between job strain and professional drivers of public transport with 720 samples in Colombia and found a positive correlation between them through multiple regression analysis. It was also found that job stress increased due to high traffic and accident issues in the state.
The above literature review reveals that stress of high competition of public SRTUs with private public transport providers and positive correlation between job satisfaction and customer satisfaction motivate SRTUs to give better bus service facilities to passengers. Hence, the need to develop the better performance analysis techniques to evaluate deterministic factors which affect the undertakings’ performance.
Research Methodology
An analysis of data for evaluation of the physical and financial performance assessed through the linear growth rate (LGR) formula and Profitability ratio technique implement in operation during the study period 2009–2010 to 2017–2018 for Haryana Roadways is conducted. Here the Ordinary Least Square (OLS) technique and LGR formula have been adopted to analyse the data.
Data collection: The study is based on secondary data, which has been collected from different government publications at Haryana and Centre levels and mainly data collected from Haryana Roadways official website like Haryana Roadways State Transport, Statistical Abstract of Haryana.
The methodology is built around the concept of simple growth rate and its definition: when a variable’s time series data displays a fairly constant increase or decrease trend, it is said to grow or fall at a simple growth rate. Using time series data and a LGR obtained by fitting a linear function to available data, the annual growth rate of physical and financial variable performance is determined in this study (Aggarwal et al., 2015). A linear trend equation is defined as follows:
![]()
Where,
Y = Dependent variable under consideration
α = Constant term, that is, intercept of Y
β = Constant term (denotes slope of the trend line)
t = Independent variable (time factor)
The following efficiency indicators (dependent variable) are used, for physical performance
Y1 = Percentage of fleet utilisation
Y2 = Vehicle utilisation
Y3 = Staff productivity
Y4 = Effective kilometre (per bus per day)
Y5 = Load factor or occupation ratio
The following efficiency indicators (dependent variable) are used, for financial performance
Y1 = Total Revenue (` Lac)
Y2 = Revenue per kilometre (Ps/km)
Y3 = Total Expenditure (` Lac)
Y4 = Expenditure per kilometre (Ps/km)
Y5 = Total Profit/Loss (` Lac)
Y6 = Effective kilometre operated (Lac KMs)
Here, Ordinary Least Square (OLS) is applied for estimating ,
, parameters values from it (Madanani, 1988). The linear growth rate (LGR) is computed by using the following formula—

Where .png) = Estimated regression coefficient of Y on t
= Estimated regression coefficient of Y on t
.png) = Average value of Y
= Average value of Y
On the basis of this formula, the evaluated the data relating to financial variable shows constant, increasing and decreasing growth rate. It is supposed to grow or decrease at a simple rate. The growth rate is called simple growth rate.
Analysis and Findings
The performance analysis of Haryana Roadways is based on the following aspects:
1. Financial aspects
2. Physical aspects
The study explains both aspects with the modified Least Square Technique and used LGR to evaluate the average annual growth rate of Haryana Roadways during the study period 2009–2010 to 2017–2018 (Aggarwal et al., 2009). First, the article attempts the financial performance aspects.
Financial Performance
The financial performance of any operational organisation should be investigated using a number of indicators, such as profit rate, revenue structure, expenditure structure, and tax or cost-related aspects. In the case of evaluating the performance of Haryana Roadways the section is divided into two sub-sections. The first section examines the profit rate, while the second section empirically evaluates the growth rate concerning financial indicators such as total revenue, revenue per effective kilometre, total expenditure, expenditure per effective kilometre, total profit/loss, and effective kilometre operated for Haryana Roadways. First, the profit rate of Haryana Roadways with table and figure representation may be analysed.
Profit Rate
The study examined the profit rate of Haryana Roadways during the period 2009–2010 to 2017–2018 with the help of the following formula:
Total Profit = Total Revenue – Total Expenditure
Table 2 and Figure 1 reveal that the total revenue of Haryana Roadways has increased from `69,957.03 Lacs in 2009–2010 and `73,277.01 Lacs in 2017–2018. Similarly, a rising trend follows in the context of expenditure cases. These were `93,972 Lacs in 2009–2010 and rise `111,174.24 Lacs. The table shows that the total profit (losses) decreased rapidly because the total expenditure was greater than the total revenue, that is why total losses have increased from `–24,014.97 Lacs in 2009–2010 to `–37,897.23 Lacs in the year 2017–2018.
Table 2. Profit Rates of Haryana Roadways.
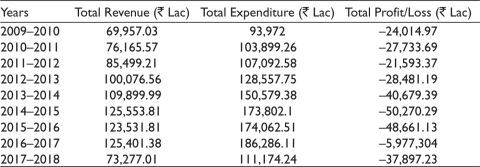
Source: Department of State Transport, Haryana.(www.trans.gov.in).
Figure 1. Total Profit/Loss of Haryana Roadways.
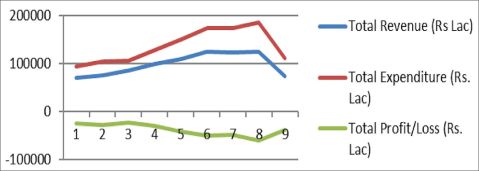
Source: The authors.
Empirical Results of Financial Performance
This section evaluates the financial performance of Haryana Roadways based on empirical verification through the OLS and LGR formula with financial variables like total revenue, revenue per effective kilometre, total expenditure, expenditure per effective kilometre, total profit/loss and effective kilometre operated, and so on, during the study period 2009–2010 to 2017–2018.
Table 3 represents the results of the estimated value of financial performance from 2009–2010 to 2017–2018 for Haryana Roadways.
Table 3. Linear Growth Rate of Financial Variable in Haryana Roadways.
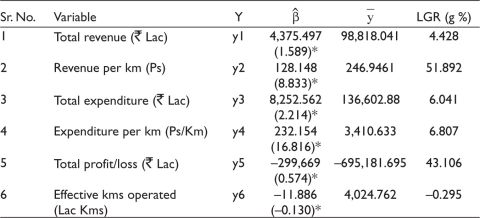
Source: The authors (compilation through SPSS software).
Note: *Show the t-test value of Coefficients.
First, y1 variable is Total Revenue which shows the increasing annual average growth rate of 4.428% during the study period.
Second, y2 variable is Revenue per kilometre in Lac which shows the increasing annual average growth rate is 51.892% in the study period.
Third, y3 variable is the Total Expenditure which reveals the increasing growth rate of 6.041% during the study period.
Fourth, y4 variable is Expenditure per kilometre shows the increasing annual average growth rate of 6.807% during the study period.
Fifth, y5 variable is Total profit/loss, in which total losses reflect the increasing annual average growth rate of 43.106% during the study period.
Sixth, y6 variable is an Effective kilometre operated reveals the decreasing annual average growth rate of –0.295% during the study period.
The above variables’ value concluded that the y5 variable total profit/loss rapidly increase (43.106%) in the financial account and the y6 variable, effective kilometre operated, has been decreasing (–0.295%) or became the most affected factor responsible for the poor performance of Haryana Roadways.
Physical Performance
To analyse the managerial or technical efficiency of an undertaking, physical performance becomes the most applicable tool. The physical performance of a transport undertaking depends on various indicators, including the percentage of fleet utilisation, vehicle utilisation in kilometre per bus per day, effective kilometre (Lac) per day, staff productivity in effective kilometre per person per day, and percentage of load factor.
Empirical Results of Physical Performance
Table 4 represents the estimated value of physical performance variables to assess the results from the period of 2009–2010 to 2017–2018 for Haryana Roadways.
Table 4. Linear Growth Rate of Physical Variable in Haryana Roadways.
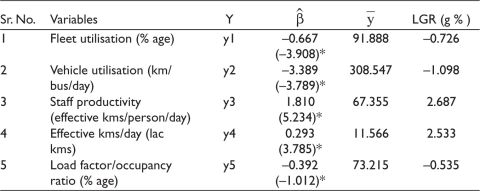
Source: The authors (compilation through SPSS software).
Note: *Show the t-test value of .png/image(3)__15x24.png) coefficients.
coefficients.
First, y1 variable is Fleet utilisation which shows the decreasing annual average growth rate of –0.726% during the study period.
Second, y2 variable is Vehicle utilisation which shows a decreasing annual average growth rate of –1.098% in the study period.
Third, y3 variable is Staff productivity which reflects the increasing annual average growth rate of 2.687% in the study period.
Fourth, y4 variable is the effective kilometre per day which reflects the increasing annual average growth rate of 2.533% assess in the study period.
Fifth, y5 variable is the load factor/occupancy ratio which shows the decreasing annual average growth rate of –0.535% during the study period.
The underlying explanation of results to the estimated value of physical performance reveals that y1 fleet utilisation, y2 vehicle utilisation, and y5 load factor are negative impacts and affect the performance of the undertaking. On the other hand, y3 staff productivity or y4 effective kilometre per day is positively contributed to the progress of Haryana Roadways. Both factors grow faster and contribute to the improvement or better running of the performance of the operation in the future.
Road Safety and Accidents Rate
Road safety has become the main motto of Haryana Roadways. It strictly follows and implements all measures of road safety to decrease the accidents rate in the state. The concerned efforts rapidly declined the accident rate on the Haryana Roadways. Accidents are divided into fatal, major and minor, and so on. Accidents rate on Haryana Roadways is presented in Table 5.
Table 5. Accidents Rate of Haryana Roadways.
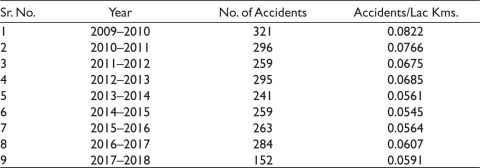
Source: Department of State Transport, Haryana.
Figure 2 represents the declining trend of accidents rate on Haryana Roadways during the period 2009–2010 to 2017–2018. The accident rate recorded in terms of numbers was 321 in the year 2009–2010 and 152 in 2017–2018 decreases.
Figure 2. Accidents Rate of Haryana Roadways.

Source: The authors.
Haryana Roadways Performance Within SRTUs of India
One may analyse the performance of Haryana Roadways within the SRTUs of India with the help of the performance report displayed by the Ministry of Road Transport and Highways of India.
The data in Table 6 represents the financial performance of India’s five most loss-leading SRTUs. Haryana Roadways has also shown poor financial performance by contributing to loss-making undertakings. The data reflects that revenue increment is much increased along with a slight increment in total cost.
Table 6. Top Five Loss-making SRTUs of India.
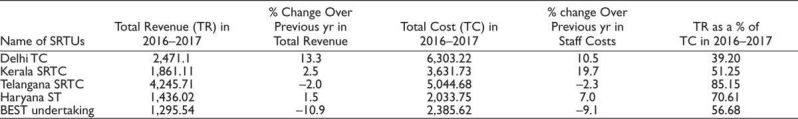 Source: Review of the Performance of State Road Transport Undertakings 2017.
Discussion
The economic analysis of the physical and financial performance of a unit of SRTUs in India is evaluated in this article using the simple growth rate with the LGR formula, and the results are analysed using SPSS. The results and findings section is divided into three sections; the first examines Haryana Roadways’ financial performance with a profit rate and empirical results of financial variables, revealing that Haryana Roadways is a loss-making undertaking due to factors such as effective kilometre operated which has been decreasing (–0.295%), and total expenditure (` lac) is 6.807% greater than total revenue (` lac) (4.428%). It is clear from the physical performance section that low fleet utilisation (–0.726%) and vehicle utilisation (km/bus/day) (–1.098%) contribute to poor performance, whereas staff productivity (effective kms/person/day) (2.687%) plays a significant role in better performance and indicates that further improvement in that specific factor made it a better-performing undertaking. The final section findings in this row show a decrease in accidents during the study period, indicating Haryana Roadways’ high road safety promise being fulfilled. Many factors contribute to loss-making ventures, including low fare charges, old model and equipment buses on the road, strikes by roadway employees, infrastructure loss in riots, such as burned buses, and the integration of welfare schemes and facilities, such as a free bus pass for female students, half-fare for the elderly, and free rides for MPs, MLAs, and soldiers. The other implication is that a lack of resources is also to blame for the management and implementation of advanced technology in the bus transportation industry.
Suggestions
The study found the many problems that affect the performance of Haryana Roadways. The suggestions are based on facts or such problems. Some reliable and easily implemented suggestions are included in the study. The given suggestions help to improve the efficiency, management, physical or financial performance, and quality of service of the Haryana Roadways. The suggestions are elaborated in two sections: the first, focus remains on the physical aspects, and second, upon the financial aspects.
Physical Aspects
In the aspect of physical improvement, Haryana Roadways extends the quality of physical indicators by taking the following initiatives:
1. From the evaluation of physical performance with empirical verification, staff productivity has positively grown. The staff productivity has risen continuously, and will rise further if the government of the state provides attractive or motivational amenities to staff in the forms of giving awards for excellent performance, raise income, promotion in the field, and emoluments to staff.
2. The productivity of fleet size rises if; old or condemned buses are replaced with modern or well-equipped buses.
3. Increase in the fleet size in each depot concerning the congested places and providing well-managed services from time to time on each route.
4. The workshops of Haryana Roadways should be well equipped with modern or efficient technology.
5. The recruitment of allied staff like technical, clerical, management, Group IV, conductor, and drivers are recruits under the supervision of good experts or those specialised in the related field.
6. The load factor or occupancy ratio in Haryana Roadways has tremendously decreased due to poor bus services. That is why the State government introduced some pleasant amenities that attract passengers to travel on Haryana Roadways.
7. The public works department (PWD) of the state of Haryana provides well-maintain road infrastructure. The metaled or better roads increase the productivity of fleet size.
8. The public passenger buses are covered under CCTV surveillance.
Financial Aspects
Haryana Roadways should take some effective steps to improve its financial performance. Some of which may be the following:
1. The fare structure is fixed by the management or operational staff to observe the cost and benefit aspects concerning Haryana Roadways. The fare structure is not influenced by political or internal power.
2. Social welfare facilities schemes are not undertaken by transport department. These facilities may be provided by the social welfare department and compensate through it.
3. Haryana Roadways increases the bus services at the time of fairs, special festivals, and tourist season to earn more revenue.
4. Haryana Roadways withdraws the concession and special subsidies to MP, MLA, EX-MLA, Police staff, and its related families because the government also gave allowances and dearness related to traveling purposes.
5. This sector needs large numbers of financial resources to recover the financial losses in the Haryana Roadways account. Therefore, the Transport Department of Haryana introduces attractive emolument and amenities to encourage private sector investment.
Conclusion
An accurate estimation of the physical, financial, and accident rate describes the performance of public transport, which plays a critical role in traffic handling or road safety. In India, SRTUs are in charge of providing safe, efficient, and passenger-oriented services. It also plays a role in reducing traffic congestion problems and giving an operational framework in regions.
Haryana Roadways recorded impressive progress in their service provided to the public passenger of the state. Along with it also faced private corporation competition. In the financial aspect, total profits reveal in decreasing order or Haryana Roadways goes running to losses environment. The effective kilometre operated or total profit/loss negatively affects the financial performance of Haryana Roadways. Despite this, total revenue, total expenditure, revenue per kilometre, or expenditure per kilometre positively affects the financial performance in increasing growth layout. The physical aspects reveal that fleet utilisation, vehicle utilisation, or load factor are decreasing and negatively affect the physical performance of Haryana Roadways. But staff productivity, effective kilometre per day, or accidents rate decreased contribute a positive impact on Haryana Roadways. On the basis of the above performance analysis, any undertaking related to departments like public transport, traffic management, or other related organisation may take initiatives of policy implementation and adopt well-managed transportation system in a county. Moreover, the study also suggests that the cooperation of central and state governments in the review of financial concessions and physical aspects regarding public transport improves the managerial efficiency of the Haryana Roadways and other SRTUs of India. Finally, the above discussed suggestions become a relevant match between the organisational framework and traffic management.
Declaration of Conflicting Interests
The authors declared no potential conflicts of interest with respect to the research, authorship and/or publication of this article.
Funding
The authors received no financial support for the research, authorship and/or publication of this article.
Aggarwal, S., Yadav, S. P., & Singh, S. P. (2009). Total factor productivity growth in the state road transport undertakings of India: An assessment through MPI approach. India Economic Review, 44(2), 203?223.
Aggarwal, S. C, Rana, R. K., & Gupta, L. (2015). Basic mathematics for economists. VK Global Publication.
Alexanderssson, G., Hultén, S., & Fölster, S. (1997). The effects of competition in Swedish local bus services. Swedish Transport Research Board, 32(2), 203?219.
Arora, R. (2016). Impact of employees satisfaction on the organization success of employees in Haryana roadways: Relationship between costumers experience and employees satisfaction. Journal of Global Information Business Strategy, 8(1).
Bell, G. J., Blackledge, D. A., & Bowen, P. J. (1983). The economics and planning of transport. William Heinemann Ltd.
Devi, S. (2005). Factor affecting the employees job?s satisfaction: A case study of UPSRTC. Perspective of Social Science and Humanities, 3(2), 47?61.
Government of Haryana. (2018). Directorate of state transport 2018. https://hartrans.gov.in/About-Us/Physical-Financial-Performance
Government of Haryana. (2019a). Haryana department of economic and statistical analysis, 2017?18. https://esaharyana.gov.in/state-statistical-abstract-of-haryana/
Government of Haryana. (2019b). Haryana department of economic and statistical analysis, 2018?19. https://esaharyana.gov.in/economic-survey-of-haryana/
Government of Haryana. (2019c). Profile of state public enterprises for 2017?18. http://www.finhry.gov.in/Profile-of-State-Public-Enterprises
Government of India. (2017). Ministry of road transport and highways 2015?16. https://morth.nic.in/Performance-%20of-State-Road
Jain, S., & Dhiman, P. K. (2018). Management control system of state transport undertaking: An analysis of Haryana roadways. Archives of Business Research, 6(5), 125?134.
Kaur, S., & Kaur, N. (2012). Growth and pattern of bus services in Punjab. International Journal of Advanced Research in Management and Social Science, 1(2).
Madanani, G. M. K. (1988). Introduction to econometric. Oxford and IBM Publishing.
Perry, J. L., & Babitsky, T. T. (1986). Comparative performance in urban bus transit: Assessing privatization strategies. Public Administration Review, 46(1), 57?66.
Pucher, J., Park, H., & Kim, M. H. (2005). Public transport reforms in Seoul. Journal of Public Transportation, 8(5).
Sriraman, S. (1999). State road transport undertaking in India. In India infrastructure report 2002. Oxford University Press.
Singh, S. K. (2000). State road transport undertaking 1983?84 to 1996?97: A multilateral comparison of total factor productivity. Indian Journal of Transport Management, 24(5), 363?388.
Useche, S. A., Gómez, V., Cendales. B., & Alons, F. O. (2018). Working conditions, job strain, and traffic safety among three groups. Safety and Health at Work, 9, 454?461.
Vijayaraghavan, T. A. S. (1995). Strategic option for state road transport undertaking in India. International Journal of public Sector Management, 8(1), 48?67.
