Review of Professional Management

 Search

Silky Vigg Kushwah1 and Sonal Thukral2
1 Department of Finance, New Delhi Institute of Management, New Delhi, Delhi
2 Department of Finance and Business Economics, University of Delhi, Benito Juarez Marg, South Campus, Dhaula Kuan, New Delhi, Delhi, India

Creative Commons Non Commercial CC BY-NC: This article is distributed under the terms of the Creative Commons Attribution-NonCommercial 4.0 License (http://www.creativecommons.org/licenses/by-nc/4.0/) which permits non-Commercial use, reproduction and distribution of the work without further permission provided the original work is attributed.
The research examines the dynamic correlation between the volatility of the Bombay Stock Exchange (BSE) and the Small- and Medium-enterprises (SMEs) Index of BSE in India. It focuses on analysing the volatility spillover between SME and BSE by utilising the generalised autoregressive conditional heteroskedasticity (GARCH) model. The study extends its scope by examining the impact of the current pandemic, COVID-19, on the volatility of both SME and BSE by utilising the exponential GARCH and threshold GARCH models. Findings suggest that there is volatility spillover between the two indices. The results also highlight that the pandemic significantly affected the volatility of both indices. The findings of the study provide important implications for policymakers, portfolio managers, and investors, particularly when the Indian government has been emphasising on the growth and continuous support of the small and medium enterprises and increasing foreign investments in India’s SMEs in recent years.
BSE SME, SME, BSE, volatility spillover, S&P BSE Sensex, stock index, stock markets
Introduction
Small- and medium-sized enterprises (SMEs) are viewed as the primary drivers of national and socio-economic development in many countries. SMEs provide more than 50% of employment and account for 90% of the businesses worldwide, making them preeminent contributors to job creation and global economic development. These numbers grow substantially when informal SMEs are taken into consideration as well. By 2030, it is estimated that in order to absorb the growing global workforce, 600 million jobs will be required to be created, thus developing and sustaining SMEs a high priority for many governments. In emerging market economies, most formal jobs are generated by SMEs, which create 7 out of 10 jobs.
The importance of SMEs has been acknowledged by economies worldwide, resulting in the establishment of SME exchanges in both developed and developing countries. In India, BSE was first to introduce its SME platform, ‘BSE-SME’, in March 2012, allowing small and medium-sized businesses and start-ups to list themselves directly on stock exchanges to raise funds. Later, NSE launched its SME platform, ‘Emerge’ in March 2012, which also connects growing businesses with a network of sophisticated investors, thus assisting start-ups and SMEs in acquiring equity capital. The SME exchange facilitates the listing and trading of specified securities for companies aiming to raise equity capital in India. These companies do not meet the requirements for a Main Board Listing on a recognised stock exchange. Compared to exchanges in India, global exchanges have further experimented with the SME platforms, such as the London Stock Exchange that have built a blockchain-based trading platform, ‘Borsa Italiana’, to digitally issue shares of small- and medium-sized enterprises (Lokeshwarri SK, 2021). Recently, China’s government also took initiative to launch a stock exchange for SMEs to boost strategic emerging and high-tech industries while also providing much-needed funding to them (Huld, 2021).
The establishment of new exchanges specifically for SMEs arouses the curiosity if diversification benefits can be reaped by investing in companies listed on both mainboard stock exchanges and the new SME exchanges. Therefore, this article endeavours to evaluate the volatility transmission between the mainboard index of the Bombay Stock Exchange (S&P BSE Sensex) and the recently formed SMEs stock index (BSE SME) in India. Additionally, the study examines the influence of COVID-19 on the volatility transmission between these two exchanges. The analysis of volatility spillover aids us in understanding as to how information is transmitted and disseminated across the two exchanges. This will help investors craft their portfolios intelligently and guide policymakers in drafting laws and regulations to establish new exchanges, especially for SMEs.
Examining the volatility connections between markets and exchanges is crucial for making informed investment and risk management choices. Evaluating volatility spillover is important because a limited connection between the mainboard and SME exchange can present investors with opportunities for diversification across stock exchanges, potentially enhancing portfolio gains. In contrast, a strong market linkage in returns would eliminate the potential benefits of diversification. Therefore, through examining the interdependence of volatility between the recently established exchange and the mainboard exchange, this study aims to offer valuable insights into the transmission and dissemination of information across markets. Such insights can assist investors in shaping their portfolios and provide guidance for policymakers in formulating laws and regulations pertaining to SMEs.
Review of Literature
The study of volatility spillover has captivated the curiosity of researchers all over the world. For various investment and risk management decisions, understanding the nature of volatility connections between markets is crucial. When portfolio managers expect stock market volatility to rise, it helps them reduce risk by transferring their capital between markets. Volatility links are important when determining regulatory policies because they provide insight into the flow of information between markets.
The literature has interrogated not only the volatility within a market but also the volatility between the markets. Earlier studies predominantly examined the volatility spillover between the developed economies (Hamao et al., 1990, 1991; Koutmos & Booth, 1995; Nathani & Kushwah et al., 2022; Patel, 2017; Savva, 2008; Susmel & Engle, 1994); and Asian markets (Kumar & Khanna, 2018). With the world integrating, there has been growing literature on volatility spillover from advanced markets to emerging markets (e.g., Goetzmann et al., 2005; Lin & Wu, 2006; Ng, 2000; Savadatti, 2018; Wang et al., 2004, 2005; Worthington & Higgs, 2004). The results, however, have been inconclusive for different markets. Volatility spillovers from the US to the Indian and Sri Lankan markets and from the Japanese to the Pakistani market have been found by Wang et al. (2005). Volatility from the US. stock market to ASEAN markets has been reported by Vo and Tran (2020).
There appears to be a dearth of literature regarding volatility spillover between long-established mainboard stock exchanges and relatively nascent SME stock exchanges. It is reasonable to assume that the older mainboard stock exchanges could impact the volatility of the newer exchanges. The emergence of these new exchanges underscores the need to investigate volatility spillover between established mainboard stock exchanges and emerging SME stock exchanges. Al-Nassar and Makram (2022) investigated the volatility spillover between the main and SME stock markets in Saudi Arabia and Egypt, analysing both pre-COVID-19 and pandemic periods. The study reveals bidirectional return spillovers limited to Saudi Arabia, with distinct characteristics and dynamics in shock and volatility spillovers across both main-SME market pairs. In the Indian context, Singh et al. (2021) examined the volatility spillover between SENSEX (BSE mainboard exchange) and the SME stock index BSE SME. Their study demonstrates statistically significant volatility and return spillover between the main market index, SENSEX, and the SME index, BSE SME. This study is the extension of the mentioned study, as the current study takes a step ahead and checks the volatility spillover effect during the specific event, COVID-19 on the stock exchanges by utilising the threshold generalised autoregressive conditional heteroskedasticity (TGARCH) model and the exponential GARCH (EGARCH) model. Further, the spillover can be amplified by an external event (e.g., crisis, bad news). Many studies have concluded that negative news, shocks, or errors create more variation or volatility than positive news, suggesting a negativity bias (Baek et al., 2020; Malik, 2011; Zhang et al., 2021). However, the market perception is not just attuned to negative signals when it comes to volatility spillovers. Baruník et al. (2016) concluded that although negative asymmetries in spillovers are often of substantial magnitude, they are not always dominant. Emenike and Enock (2020) suggested that good news impacts stock return volatility more than bad news of similar weight. Hence, the present article also attempts to investigate the impact of COVID-19 on volatility spillover among the two stock exchanges.
Data and Methodology
The current study analyses the relationship between the volatility of the Bombay stock exchange’s index, S&P BSE SENSEX 30, and the BSE SME index. It attempts to check the volatility spillover between the two indices. The study also analyses the impact of the COVID-19 event on the volatility spillover between the S&P BSE Sensex and BSE SME (Kushwah & Negi, 2023). Literature supports the use of the GARCH (1, 1) model to estimate such relationships (Joshi, 2021; Kaur & Singh, 2019; Khanna & Kumar, 2020). Secondary data, in the form of daily indices’ prices, is collected from a reliable website, www.bseindia.com, covering from 01 August 2014 to 31 March 2021. Daily log return is calculated to remove the problem of heteroscedasticity (Bhatia & Kushwah, 2023; Kushwah & Garg, 2020). Following Yu (2002) and Kushwah & Vigg (2023), return (r) is the natural log of the first difference of daily price:
.jpg/10_1177_09728686241249332-eq1(1)__114x19.jpg)
where Xt is the return for time t, Pt is the price at time t, and Pt – 1 is the price at time t and .png) 1. To study the volatility spillover using the GARCH (1, 1) model, it is essential to analyse the presence of autoregressive conditional heteroscedasticity (ARCH) effect in the time series. Therefore, the ARCH effect is investigated by employing the heteroscedasticity test, and the ARCH effect is apparent. Figure 1 depicts the methodology applied in the study.
1. To study the volatility spillover using the GARCH (1, 1) model, it is essential to analyse the presence of autoregressive conditional heteroscedasticity (ARCH) effect in the time series. Therefore, the ARCH effect is investigated by employing the heteroscedasticity test, and the ARCH effect is apparent. Figure 1 depicts the methodology applied in the study.
Figure 1. Methodology.
.jpg/10_1177_09728686241249332-fig1(2)__600x173.jpg)
The stationarity of the data is also examined, as it is necessary for the time series to be stationary for applying the GARCH (1, 1) model (Kushwah & Siddiqui, 2023; Siddiqui & Kushwah, 2021, 2022). Nelson and Plosser (1982) suggest a method to detect stationarity and the stochastic trend using the unit root test (Dritsaki & Dritsaki-Bargiota, 2005; Elliot et al., 1996). So, for examining the stationarity, the ADF test is used (Dickey & Fuller, 1979), and it takes the form as follows:

The GARCH (1, 1) model best fits the current study as it examines the conditional volatility among the two stock indices with a heteroskedastic nature (Bollerslev, 1986; Taylor, 1987). Two equations, one for mean and the other for conditional variance, are formed.
Mean equation in GARCH (1,1) model is written as
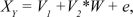
where X.Y. = return of the dependent variable, V1 is a constant, W is the independent variable, and V2 is the coefficient.
Variance equation in GARCH (1,1) model takes the form

where Zt is the variance of the dependent variable’s return.
The EGARCH model is an extension of the general GARCH model, employed to examine asymmetric volatility in data. The EGARCH variance equation, assuming a normal distribution, is provided below:

where .png) is the intercept,
is the intercept, .png) is the coefficient for the logged GARCH term, ‘vt – 12’ is the logged GARCH term, c is the asymmetric volatility, ‘
is the coefficient for the logged GARCH term, ‘vt – 12’ is the logged GARCH term, c is the asymmetric volatility, ‘.png)
.png) ’ is the shock of last period’s, and ‘
’ is the shock of last period’s, and ‘.png) ’ is the value of last time period’s volatility shock. It is in place of the ARCH term.
’ is the value of last time period’s volatility shock. It is in place of the ARCH term.
The TGARCH model is an extended model of general GARCH used to check the leverage effect. It checks the asymmetric impact of bad or good news on a time series. It finds out whether the negative news or positive news has more impact on the volatility of the financial time series by studying the mean and conditional variance of the data by the following equation:

Results and Discussion
The basic properties like mean, standard deviation, etc. of all the time series are reflected in Figure 2 and Figure 3. The tables highlight the descriptives of two series named S, which represents S&P BSE Sensex log returns, and series name SME that represents BSE SME log returns.
Figure 2. Descriptives of S&P BSE Sensex 30 Returns.
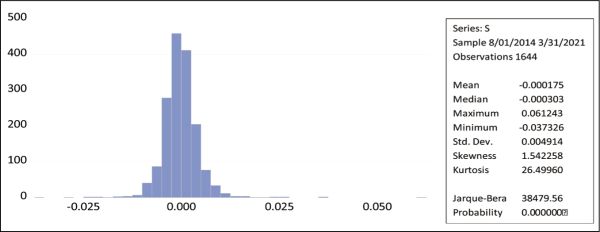
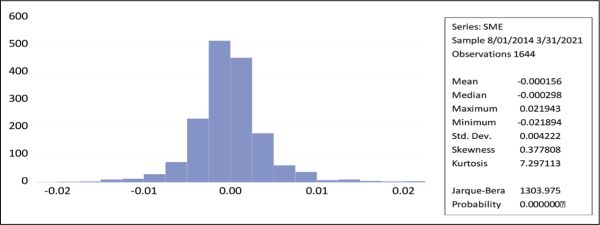
Figure 3. Descriptives of SME Index Returns.
The above graph depicts the descriptives of S&P BSE Sensex 30 log returns (S). The graph highlights the mean value of S&P BSE Sensex, which is --0.000175. The values of skewness and kurtosis of S&P BSE Sensex 30 returns are 1.54 and 26.499, respectively. The results also witness that the S&P BSE Sensex index log-returns series is not normally distributed.
The above graph depicts the descriptives of SME index log returns (SME). The graph highlights the mean value of S&P BSE Sensex, which is --0.000156. The values of skewness and kurtosis of S&P BSE Sensex 30 returns are 0.37 and 7.29, respectively. The results also witness that the SME index log return series is not normally distributed.
The log-transformed data for the returns of S&P BSE SENSEX 30 and BSE SME are tested for stationarity (Table 1), and it indicates the absence of unit root in both the time series used in the study. The p values are less than .05, so the null hypotheses are rejected. Hence, the test results confirm that the series is stationary. Since series are stationary, the next step is to determine the best mean-fitting equation through the auto-regressive process. Consequently, the pre-mentioned analysis supports the application of the ARCH and GARCH models in the gathered data.
Table 1. Summary of Unit Root Test.
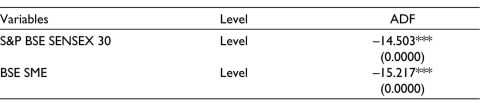
Note: * Significant at 10%, **Significant at 5%, ***Significant at 1% level of significance.
To examine the volatility spillover between S&P BSE SENSEX 30 and BSE SME, the GARCH (1, 1) model is applied. Two GARCH (1, 1) models are executed: model one investigates the volatility spillover from S&P BSE SENSEX 30 to BSE SME, while model 2 studies the impact of BSE SME on S&P BSE SENSEX 30. Three methods, namely Normal Gaussian Distribution, Student’s distribution, and Generalised error distribution, are used in the GARCH (1, 1) model. Table 2 points out the volatility spillover from S&P BSE SENSEX 30 to BSE SME. The model using the normal distribution method shows that the ARCH and the GARCH terms are both significant. The p value of S&P BSE SENSEX 30 is significant, indicating that it affects BSE SME’s returns. The results highlight that BSE SME’s volatility is affected by internal and external shocks, and there is a volatility spillover from S&P BSE SENSEX 30 to BSE SME. It is evident that the other two methods, namely Student’s distribution and Generalised error distribution, also highlight a similar result in that there is a volatility spillover from S&P BSE SENSEX 30 to BSE SME. Table 3 indicates Model 2, reflecting the volatility spillover from BSE SME to S&P BSE SENSEX 30. Model 2, using the normal distribution method, confirms that both the ARCH and GARCH terms are significant. The p value of BSE SME is significant, reflecting its impact on S&P BSE SENSEX 30’s return. The study concludes that both volatility spillover and cross-volatility spillover are witnessed in S&P BSE SENSEX 30. Similar results are obtained from the other two GARCH (1, 1) models, namely Student’s distribution and Generalised error distribution.
Table 2. GARCH Model 1.

Notes: BSE SME is the dependent variable.
*Significant at 10%, **Significant at 5%, ***Significant at 1% level of significance.
Table 3. GARCH Model 2.
.jpg/10_1177_09728686241249332-table3(1)__480x119.jpg)
Notes: S&P BSE SENSEX 30 is the dependent variable.
*Significant at 10%, **Significant at 5%, ***Significant at 1% level of significance.
In the study, TGARCH and EGARCH are used to analyse the impact of COVID-19 on the volatility of both the indices, S&P BSE SENSEX and BSE SME. TGARCH enabled us to study the leverage effect on both the series, separately, by examining the negative news, in our case, COVID-19 news, to determine whether it has a significant impact on the study variables. The parameter estimation for the TGARCH (1, 1) model is presented in Table 4 and Table 5.
Table 4. TGARCH Model.
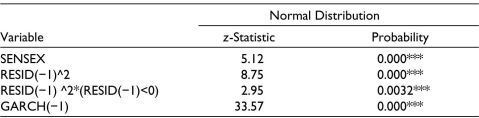
Notes: BSE SME is the dependent variable.
*Significant at 10%, **Significant at 5%, ***Significant at 1% level of significance.
Table 5. TGARCH Model.
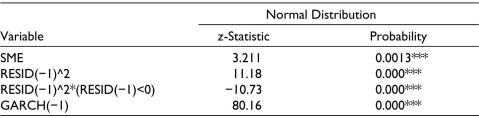
Notes: SENSEX is the dependent variable.
*Significant at 10%, **Significant at 5%, ***Significant at 1% level of significance.
Again, two TGARCH models have been applied running each time series, with S&P BSE SENSEX and BSE SME as dependent variables. The results reflect that the negative news of pandemic is significantly impacting the volatility of the BSE SME Index because the coefficient of RESID (.png) 1) ^2*(RESID (
1) ^2*(RESID (.png) 1) <0) is negative and its p value is .0000 < .01. Thus, it is witnessed under the TGARCH model that there is a significant impact of COVID-19 on the returns of both S&P BSE SENSEX and BSE SME. The EGARCH model is also used to investigate the volatility variation in the two important stock indices, S&P BSE SENSEX and BSE SME, and the effects of COVID-19 pandemic on them. Table 6 and Table 7 represent the results of EGARCH on the data, and they reflect the leverage effect. It can be concluded that there exists ‘significant negative leverage effects’. Good news results in lower volatility as compared to the bad news for both the indices.
1) <0) is negative and its p value is .0000 < .01. Thus, it is witnessed under the TGARCH model that there is a significant impact of COVID-19 on the returns of both S&P BSE SENSEX and BSE SME. The EGARCH model is also used to investigate the volatility variation in the two important stock indices, S&P BSE SENSEX and BSE SME, and the effects of COVID-19 pandemic on them. Table 6 and Table 7 represent the results of EGARCH on the data, and they reflect the leverage effect. It can be concluded that there exists ‘significant negative leverage effects’. Good news results in lower volatility as compared to the bad news for both the indices.
To understand how the model explains the tested relationship, the study utilises certain residual diagnostic tests: heteroscedasticity test, serial correlation, and normal distribution on the residuals. The results of serial correlation for all three methods of all the models highlight that all the probability values are more than .05, indicating the absence of serial correlation, which is desirable for a strong model. The Jarque–Bera test suggests that the residual data is not normally distributed, which is not desirable. Finally, the findings of the heteroscedasticity test for all the methods involved in the GARCH (1, 1) models report no heteroscedasticity effect. Therefore, the findings confirm that the models are strong enough to predict volatility spillover between the two time series, S&P BSE SENSEX 30 and BSE SME.
Table 6. EGARCH Model.
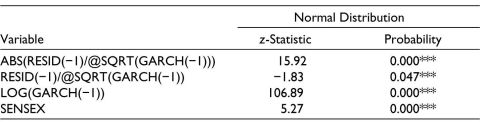
Notes: BSE SME is the dependent variable.
*Significant at 10%, **Significant at 5%, ***Significant at 1% level of significance.
Table 7. EGARCH Model.
.jpg/10_1177_09728686241249332-table7(1)__480x120.jpg)
Notes: SENSEX is the dependent variable.
*Significant at 10%, **Significant at 5%, ***Significant at 1% level of significance.
The study asserts that there is volatility spillover among the two indices, S&P BSE SENSEX 30 and BSE SME. Although, to the best of the authors’ knowledge, no study has yet examined the volatility relationship between SMEs’ market and the major stock market, the results are consistent with Hamao et al. (1990, 1991), Koutmos and Booth (1995), Susmel and Engle (1994), Kanas (2000), and Hamao et al. (1990, 1991). Specifically, they all found volatility spillovers between some stock markets. Koutmos and Booth (1995) witnessed that negative innovation in a given market increases volatility in the next market. Susmel and Engle (1994) also documented volatility spillovers between the New York and London equity markets. Volatility spillovers are witnessed among European stock markets by Kanas (2000). On the other hand, Wei et al. (1995) find no spillover effect between the markets.
Conclusion
The volatility spillover effect of financial markets has been an important area of study in the world of finance and economics. Since SMEs are considered the backbone of any resilient economy, it is important for academicians and researchers to pay greater attention to their performance and to comprehend the volatility linkages between their returns and the broader exchange returns. In this article, we have attempted to investigate the impact of COVID-19 on the volatility spillovers between the BSE SME index and S&P BSE Sensex index.
The present study shows the existence of a two-way volatility spillover between the two indices, implying that the two stock indices are integrated. In general, the results of significant bidirectional volatility spillover also suggest that there is an information flow (transmission) between the markets and that the markets are integrated (linked) with each other (Mishra et al., 2007). The empirical analysis also reveals that the spillover effect was further amplified during the COVID-19 pandemic period. The understanding of volatility is important because it is an important factor in portfolio management, risk management, and pricing of financial securities. This study has important implications for policymakers, investors, and portfolio managers. Formulation and implementation of strong relevant policy measures are required for the stabilisation of the financial system. Policymakers need to be mindful of the potential spillover effects from mainboard exchanges onto younger exchanges and should reform policies to mitigate any adverse impacts of investments in one exchange on another. Additionally, they should exercise caution regarding the heightened risk of contagion spreading to SMEs, particularly during financial crises. The insights from the study can aid policymakers in analysing the co-movements of correlated stock indices and in formulating appropriate policies to uphold financial stability. From the investors and portfolio managers perspective, the two-way volatility spillover suggests a minimal potential for portfolio diversification, as it would not reap many benefits considering interdependence between the broader exchange (S&P BSE Sensex) and BSE SME Index. Thus, the investors and portfolio managers looking for potential investment opportunities should pay close attention to these interdependencies and adjust their asset allocation and investment strategies accordingly. Investors should structure their portfolios to emphasise non-integrated investment avenues with minimal spillover effects. To enhance investment efficiency, they can also identify cross-market volatility spillovers and pursue arbitrage opportunities. In conclusion, the findings of our study provide implications for portfolio diversification and risk management that could aid investors in their decision-making in Indian financial markets. Further, our study provides future research directions wherein researchers can undertake an in-depth exploration of the price risk caused by volatility spillovers in the stock markets. The researchers can also construct portfolios to see if they can reap the diversification benefits by investing in companies listed on the mainboard and new stock exchanges.
Declaration of Conflicting Interests
The authors declared no potential conflicts of interest with respect to the research, authorship and/or publication of this article.
Funding
The authors received no financial support for the research, authorship and/or publication of this article.
ORCID iD
Silky Vigg Kushwah https://orcid.org/0000-0003-0437-8775
Al-Nassar, N. S., & Makram, B. (2022). The COVID-19 outbreak and risk–return spillovers between main and SME stock markets in the MENA region. International Journal of Financial Studies, 10(1), 6.
Baek, S., Mohanty, S. K., & Glambosky, M. (2020). COVID-19 and stock market volatility: An industry level analysis. Finance Research Letters, 37, 101748.
Baruník, J., Kočenda, E., & Vácha, L. (2016). Asymmetric connectedness on the US stock market: Bad and good volatility spillovers. Journal of Financial Markets, 27, 55–78.
Bhatia, P., & Kushwah, S. V. (2023). Diversification potential among the n-10 countries: An empirical investigation. International Journal of Accounting and Business Finance, 9(1), 145–166.
Bollerslev, T. (1986). Generalized autoregressive conditional heteroskedasticity. Journal of Econometrics, 31, 307–327.
Dickey, O. A., & Fuller, W. A. (1979). Distribution of the estimators for autoregressive time series with a unit root. Journal of the American Statistical Association, 74, 421–431.
Dritsaki, C., & Dritsaki-Bargiota, M. (2005). The causal relationship between stock, credit market, and economic development: An empirical evidence for Greece. Economic Change and Restructuring, 38, 113–127.
Elliott, G., Rothenberg, J. T., & Stock, J. H. (1996). Efficient tests for an autoregressive unit root. Econometrica, 64, 813–836.
Emenike, K. O., & Enock, O. N. (2020). How does news affect stock return volatility in a frontier market? Management and Labour Studies, 45(4), 433–443.
Goetzmann, W. N., Li, L., & Rouwenhorst, K. G. (2005). Long-term global market correlations. Journal of Business, 78(1), 1–38.
Hamao, Y. R., Masulis, R. W., & Ng, V. K. (1990). Correlations in price changes and volatility across international stock markets. Review of Financial Studies, 3(2), 281–307.
Hamao, Y. R., Masulis, R. W., & Ng, V. K. (1991). The effect of the 1987 Stock Crash on international financial integration. In W. T. Ziemba, W. Bailey & Y. R. Hamao (Eds.), Japanese Financial Market Research, (pp. 483–502). Elsevier.
Huld, A. (2021, November 18). The New Beijing Stock Exchange for SMEs – What You Need to Know. China Briefing. https://www.china-briefing.com/news/beijing-stock-exchange-for-smes-what-we-know/
Joshi, N. A. (2021). Volatility, open interest, and trading volume in Indian futures markets. Indian Journal of Finance, 15(11), 41–54.
Kanas, A. (2000). Volatility spillovers between stock returns and exchange rate changes: International evidence. Journal of Business Finance and Accounting, 27(3–4), 447–467.
Kaur, H., & Singh, R. (2019). Modelling volatility clustering and asymmetry: A study of Indian index futures markets. Indian Journal of Finance, 13(3), 41–54.
Khanna, S., & Kumar, A. (2020). GARCH and TGARCH approach to information linkages. Indian Journal of Finance, 14(8–9), 35–51.
Koutmos, G., & Booth, G. G. (1995). Asymmetric volatility transmission in international stock markets. Journal of International Money and Finance, 14(6), 747–762.
Kumar, A., & Khanna, S. (2018). GARCH-BEKK approach to volatility behavior and spillover: Evidence from India, China, Hong Kong, and Japan. Indian Journal of Finance, 12(4), 7–19.
Kushwah, S. V., & Garg, M. (2020). The determinants of foreign direct investment: A VECM approach. International Journal of Accounting and Business Finance, 6(2), 55–70.
Kushwah, S. V., & Negi, P. (2023). Impact of COVID-19 on the stock performance: A study of oil and gas companies listed on national stock exchange. The Journal of Indian Management and Strategy, 28(4), 28–38.
Kushwah, S. V., & Siddiqui, A. A. (2023). Relationship between oil price movements and stock returns of oil firms in oil importing economies. Global Business Review, 24(5), 916–932.
Kushwah, S. V., & Siddiqui, A. A., & Singh, P. (2022). Dynamics of financial development, innovation, trade, and economic growth: Evidence from developed and developing nations. International Journal of Accounting and Business Finance, 8(1), 102–122.
Kushwah, S. V., & Vigg, C. A. M. (2023). The effect of credit rating announcements on stock returns of banks in India. Afro-Asian J. of Finance and Accounting, 13(1), 41–53.
Lin, J. L., & Wu, C. S. (2006). Modeling China’s stock markets and international linkages. Airiti Library, 44(1), 1–31.
Lokeshwarri SK. (2021, August 11). Time for new generation stock exchanges. BusinessLine. https://www.thehindubusinessline.com/opinion/columns/time-for-new-generation-stock-exchanges/article35860489.ece
Malik, F. (2011). Estimating the impact of good news on stock market volatility. Applied Financial Economics, 21(8), 545–554.
Mishra, A. K., Swain, N., & Malhotra, D. K. (2007). Volatility spillover between stock and foreign exchange markets: Indian evidence. International Journal of Business, 12(3).
Nathani, N., & Kushwah, S. V. (2022). Volatility study in some of the emerging stock markets: A GARCH approach. World Review of Science, Technology and Sustainable Development, 18(3–4), 364–378.
Nelson, C. R., & Plosser, C. R. (1982). Trends and random walks in macroeconmic time series: Some evidence and implications. Journal of Monetary Economics, 10(2), 139–162.
Ng, A. (2000). Volatility spillover effects from Japan and the US to the Pacific–Basin. Journal of International Money and Finance, 19(2), 207–233. https://doi.org/10.1016/S0261-5606(00)00006-1
Patel, R. J. (2017). Co-movement and integration among stock markets: A study of 14 countries. Indian Journal of Finance, 11(9), 53–66.
Savadatti, P. M. (2018). Association between Indian and US stock markets: Volatility spillover effect using GARCH models. Indian Journal of Research in Capital Markets, 5(1), 25–34.
Savva, C. S. (2008). Journal of International Financial Markets, Institutions & Money, 19, 645–661.
Siddiqui, A. A., & Kushwah, S. V. (2021). Carbon emissions, economic growth and trade: Empirical evidence from trading nations. International Journal of Technology Management and Sustainable Development, 20(1), 61–78.
Siddiqui, A. A., & Kushwah, S. V. (2022). Oil prices and equity returns: Analysis of oil exporting economies. Bank Parikrama, 47(3 and 4), 137–158.
Singh, A. K., Agarwal, R., & Shrivastav, R. K. (2021). Returns and volatility spillover between BSE SENSEX and BSE SME stock exchange of India. SEDME (Small Enterprises Development, Management and Extension Journal), 48(3), 257–271.
Susmel, R., & Engle, R. F. (1994). Hourly volatility spillovers between international equity markets. Journal of International Money and Finance, 13(1), 3–25.
Taylor, S. J. (1987). Forecasting the volatility of currency exchange rates. International Journal of Forecasting, 3(1), 159–170.
Vo, X. V., & Tran, T. T. A. (2020). Modelling volatility spillovers from the US equity market to ASEAN stock markets. Pacific-Basin Finance Journal, 59, 101246.
Wang, P., Liu, A., & Wang, P. (2004). Return and risk interactions in Chinese stock markets. Journal of International Financial Markets, Institutions and Money, 14(4), 367–383.
Wang, Y., Gunasekarage, A., & Power, D. M. (2005). Return and volatility spillovers from developed to emerging Capital Markets: The case of South Asia. In A. Pacific (Ed.), Financial Markets in Comparative Perspective: Issues and Implications for the 21st Century, 86 (pp. 139–166).
Wei, K. J., Liu, Y. J., Yang, C. C., & Chaung, G. S. (1995). Volatility and price change spillover effects across the developed and emerging markets. Pacific-Basin Finance Journal, 3(1), 113–136.
Worthington, A., & Higgs, H. (2004). Transmission of equity returns and volatility in Asian developed and emerging markets: A multivariate Garch analysis. International Journal of Finance and Economics, 9(1), 71–80.
Yu, J. (2002). Forecasting volatility in the New Zealand stock market. Applied Financial Economics, 12(3), 193–202.
Zhang, N., Wang, A., Haq, N. U., & Nosheen, S. (2021). The impact of COVID-19 shocks on the volatility of stock markets in technologically advanced countries. Economic Research-Ekonomska Istraživanja, 1–26. https://doi.org/10.1080/1331677X.2021.1936112
