Review of Professional Management

 Search

Financial Year and Calendar Year Effects Across Indian Sectors: A Revisit from Investors Perspective
Parul Bhatia1 and Niyati Chaudhary2
1 Shri Vishwakarma Skill University, Dudhola, Palwal, Haryana, India
2 SGT University, Gurugram, Haryana, India

Creative Commons Non Commercial CC BY-NC: This article is distributed under the terms of the Creative Commons Attribution-NonCommercial 4.0 License (http://www.creativecommons.org/licenses/by-nc/4.0/) which permits non-Commercial use, reproduction and distribution of the work without further permission provided the original work is attributed.
Anomalies in stock markets have been studied with varied approaches worldwide, and mixed outcomes exist. The present study has investigated the financial year and calendar year effect for indices from Indian markets. Sectoral indices from Indian markets have been incorporated in this study on the basis of their weightage in the stock market. Data from 2011 to 2023 have been engaged with historical prices of these indices taken from the stock exchange websites. The analysis has been carried out using the ordinary least squares regression method and the independent sample t-test. Weak anomalies have been documented in the case of the financial services sector. Therefore, the findings indicate rare possibilities for investors to gauge abnormal returns with strategies related to anomalies. With increasing transparency in the online trading mechanism, such possibilities cease to exist for investors. Moreover, market dynamics have transformed on account of several shocks such as COVID-19, Omicron, Russia–Ukraine, Visa-related international issues in the world over economies and financial markets. Investors and markets have become more cautious and look out for a precautionary approach while dealing in stock market trading.
Financial year, calendar year, OLS, stock returns, investor, anomalies
Introduction
Anomalies prevail at varied intervals of time and may be of different kinds in the stock markets (El et al., 2021) like day, week or month. Stock returns may be high or low due to such anomalies offering opportunities at various stages to investors. The efficient market hypothesis EMH— also known as efficient market theory—provides theoretical variant in the pricing of stocks, which explains the concept of market efficiency (Neeraja & Srikanth, 2014). Adaptive market hypothesis (AMH) is a more refined variant that indicates the fluctuation in the market and possible factors (Ito & Sugiyama, 2009; Kim et al., 2011). Several studies in the field of anomalies have provided mixed outcomes in Indian and international stock markets (Hiremath & Kumari, 2014; Lim et al., 2008; Noda, 2012; Rosini & Shenai, 2020; Urquhart & Hudson, 2013).
The results from Indian stock markets have reflected different anomalies in diverse periods in line with EMH theory. It has been shown that anomalies and their effect vary over market conditions as well as investor expectations (Hiremath & Kumari, 2014; Shahid & Sattar, 2017). Efficient stock markets narrate that all information stands available affecting the prices meaning that investors would have no chance to earn abnormal profits (Al-Rjoub & Alwaked, 2010). This phenomenon has been further studied with new available information in the market which may be more appropriate in return prediction in comparison to past prices of the stock (Chaker & Sabah, 2018). Further, Urquhart and McGroarty (2014) mentioned that there may be no such condition of efficient market rather continuous variation in market due to the seasonal anomalies. The identification of anomalies sparks investigations into the information efficiency of stock markets, providing a platform for market participants to craft successful trading strategies and potentially secure returns surpassing the typical benchmarks. Over the past four decades, changes in calendar effects have been a focal point of research in African stock markets, commodity markets to name a few (Andrew & Seth, 2023; Chhabra & Gupta, 2022; El et al., 2021; Li et al., 2023). Anomaly may be an important element to be analysed for the estimation of stock returns (Guo et al., 2020). It depends upon the risk perception of the investors and uncertainty in the markets (Chaudhary et al., 2020; Engelberg et al., 2020).
Indian stock market has experienced more volatility during the COVID-19 period. However, market efficiency theory mentioned that if markets are rational, then prices reflect all available information (Dash & Mahakud, 2015). The calendar year effect vanished over the time (Sawitri & Astuty, 2018), and calendar anomalies diminished post the global financial crisis period in various sectoral indices in the Bursa Malaysia stock exchange (Kaur et al., 2019). Further events such as holidays, climate changes and policy regime alterations may affect the returns of various stocks. Anomalies pertain globally, but the January effect has been one of the most important anomalies. In addition, the calendar effect has been an important anomaly affecting the returns of stocks (Floros & Salvador, 2014). These effects have been explored by the agents and potential investors in financial markets for obtaining abnormal returns (Chaudhary et al., 2020). Indian markets have been more volatile than the global markets. Liquidity, transparency and investment culture have been the major contributors to such variations (Izzeddien, 2021). December and March have also been studied for the Karachi Stock Exchange and the Pakistan Stock Exchange showing inefficiencies (Anjum, 2020; Elangovan, 2022). Also, seasonality deviations have been prevalent in longer periods for such anomalies (Kaushik & Nagarkar, 2023).

.jpg/10_1177_09728686241262103-table2(1)__500x399.jpg)
Contribution of the Study
This study has examined sectoral indices within the Indian stock market laying emphasis on identified anomalies. The time period selected for the study and its impact on anomalies have not been explored before for investors’ understanding. Thus, the present work shall be a guide for investors to make informed decisions and understand the complexity and behaviour of markets during possible shocks. Calendar and financial year effects, which have been earlier recognised in the studies, have not been present significantly in the results. Thus, a newer direction and strategy in improved mechanisms of stock market trading may be formulated with the help of results of the study. Additionally, by examining anomalies over an extended timeframe, the study identifies more robust and persistent trends, offering greater confidence to investors when making investment decisions. The result of the present study will also add to the existing literature and will prove helpful for the investors to take correction actions while investing in the Indian stocks. The twin effect of the financial year and calendar year assists the academicians and potential investors to find out the better return for the stocks in various sectors.
The manuscript has been divided into six sections. The first section explains the introduction. The second section narrates the previous studies existing in the literature. The research methodology has been explained in the third section. The fourth section presents the analysis and findings. The fifth section concludes the study, and the sixth section reflects upon the further scope in the direction of anomaly studies.
Literature Review
Calendar Year Effects
Stock market seasonality is known as calendar anomalies (Alvarado & Demmler, 2019). The January month is also having the tax hypothesis effect. The January effect is one of the most popular effects of calendar anomalies in which investors expect a higher return than other months. Andrew and Seth (2023) studied the calendar anomalies in petroleum and petroleum products and found variation in the return across the energy commodities. Few authors found the January effect in their study (Gouider et al., 2015; Selvakumar, 2011; Singh & Das, 2020) and specified the reason that investors buy at the starting of the year with higher return expectations. Rosini and Shenai (2020) mentioned the time-variant behaviour of calendar anomalies in the US stock market (Faisal & Majid; 2016). For example, in December, investors sell their shares for tax loss, leading to a decline in the prices of shares, whereas by the end of December, they purchase shares that increases the prices of shares and has a positive impact on the return of stocks in January. For different stock markets, different results were found by many researchers. Researchers such as Floros (2008) (Athens), Ariss et al. (2011) (Gulf Cooperation Council indices), Iqbal et al. (2013) (Pakistan) and Al-Saad & Moosa (2005) (Kuwait), Kaur et al. (2019) (Malaysia) found no January effect on return of stocks, whereas Wong et al. (2006) found positive and significant return for the Singapore stock market. There was no January effect in BSE and NIFTY returns (Kaur, 2004), although the February and April effects were observed in NIFTY instead of the January effect (Jain, 2019; Saxena et al., 2021). No calendar anomalies in France, Germany, Italy and Spain stock exchange indices were found (Rossi & Gunardi, 2018). The August and November effects in Bursa Malaysia stock exchange were observed (Kaur et al., 2019). Acharya et al. (2022) mentioned about the September effect in the Indian stock market, because in India, the festive season starts from September.
Different month effects are found in different countries, such as the December effect is found in India by Parikh (2009), while the May effect is found by Purohit and Tyagi (2015) and the positive November effects are found by Chakrabarti and Sen (2008) for the firms listed in the Shanghai Stock Exchange. In the Karachi Stock Exchange, high return is observed in December, while in the Pakistan Stock Exchange, high return is noted in March (Anjum, 2020). The year-end effect or income tax savings or festive season may be the reason for such results (Faisal & Majid, 2016; Purohit & Tyagi, 2015; Sarbapriya, 2012). While the September month had a positive effect on the Iranian capital market because of Eid (Ansari & Jafari, 2020). The September effect was found in the Indonesian Stock Exchange, the May effect was found in Spain’s IBEX35, and the February effect was found in England’s FTSE100 (Sawitri & Astuty, 2018).
Financial Year Effects
Negative return in the month of March was found by Sarbapriya (2012). Some researchers stated the absence of turn-of-the-month effect in the return of stocks in the Indian stock market (Kushwah & Munshi, 2018; Nageswari et al., 2011) and in the Mexican stock market (Alvarado & Demmler, 2019; Ansari, 2020). No anomalies in the Indian stock market, especially in March and April months, were observed for stocks (Bhatia, 2021), while Elangovan (2022) observed a month-of-the-year effect present in March in Indian stock exchange.
Qadan et al. (2021) studied the seasonal and calendar anomalies in cryptocurrencies for measuring the pricing efficiency. Rare opportunities are there in Indian stock market for higher return for investors (Bhatia, 2021). Li et al. (2024) and Kaushik and Nagarkar (2023) also stated the presence of seasonal variations in long tenure data.
Sectoral Effects
Chaudhary et al. (2020) revealed that during the Covid period, the banking sector, the realty sector and capital goods had the poorest return, while the healthcare sector and the IT sector showed a positive return. Inefficient information is the main source of anomalies in different sectors of the Indonesian stock market (Said et al., 2018). Covid had a less negative impact on anomalies in the Indian stock market than its peers (Sudha et al., 2020). Although the effect of seasonal anomalies disappeared in the post-crisis period (Adam et al., 2016), the calendar effect was found in different sectors of the Mexican stock market, such as the health care sector, financial sector, consumer sector and telecommunication sector (Alvarado & Demmler, 2019). Cristi et al. (2020) suggested to invest in the low volatility stocks of pharmaceutical, fast moving consumer goods (FMCG) and IT sector in the Indian stock market when preparing their investment strategy for high return. While the IT sector of the Indian stock market was found to be a weak form of efficiency, the January and turn-of-month effects on return and further volatility were mentioned in the IT and banking sectors of India (Singh & Das, 2020). Multi-commodity exchange was studied by Chabra and Gupta (2022), and they found the presence of the anomalies effect in the Indian stock exchange. Li et al. (2022) studied the crude oil market and reported the same. While the absence of anomalies was reported by Bankoti (2021), Li et al. (2023) and Li et al. (2022) mentioned that the effect of anomalies declined with high volatility in the US stock market.
Research Gap
The existing literature on anomalies in the Indian stock markets has shown the presence of the mixed form of anomalies. These inefficiencies persist in the form of day/week/month arrangements where studies indicate the presence/absence of anomalies in various industries and stocks (Engle et al., 1990; Tadepalli & Jain, 2018). Calendar year and financial year anomalies have also been tested earlier with varied research methods for stock market indices and individual stocks (Ansari, 2020; Bhatia, 2021; Jain, 2019; Kushwah & Munshi, 2018; Singh & Das, 2020). However, there remains a strong gap in analysing the sectoral indices for the time period considered in the present study. Therefore, with this strong notion based on the current literature, the present work will contribute to the understanding of the investors. Attention may be paid to the existing regime of stock market anomalies before plugging the funds into the market.
Hypotheses
H1: There exists a calendar year effect for sectoral indices in Indian markets.
H2: There exists a financial year effect for sectoral indices in Indian markets.
H3: There is a spillover from March returns to April returns for Indian sectoral indices.
H4: There is a spillover from December returns to January returns for Indian sectoral indices.
Research Methodology
Data
The historical indices for automobiles (Auto), financial services (FS), media, FMCG, pharmaceuticals (Pharma), metal, realty, information technology (IT), energy and banking (Bank) have been incorporated. These historical values of 2011–2019 have been downloaded from the website of the National Stock Exchange. Due to Covid impact, data after December 2019 have been avoided as the results may not be reliable during this period. The historical returns have been computed with the help of the following formula:
 (1)
(1)
Variables
The objectives of the study required monthly data of four months, in particular for Indian sectoral indices. The investigation of the financial year effect called for March and April returns, while the calendar year effect desired December and January returns. Companies may make major announcements during these months due to the closing of the books of accounts. Therefore, these four months have been identified and incorporated in the study to explore anomalies across different sectors in the Indian economy.
Sample Selection
Indian markets may be split into a variety of sectors such as banking, IT, automobiles and pharmaceuticals. The sector-wise contribution to stock markets as well as Indian economy however remains prevalent by a few sectors. The study has tried to incorporate such sectors for investigating the presence of anomalies across Indian markets. A brief justification for sample selection has been provided in Table 2.

Test for Stationary Series
Time series analysis and modelling require the data to be stationary at the outset. The preliminary assumption of stationary series has been tested with the augmented Dickey–Fuller statistic. The index returns have been found stationary at level and thus integrated at I(0).
Independent Sample t-Test
Initially, the significant difference between two groups of returns, namely March–April and December–January, have been tested. This investigation has been carried out with the independent sample t-test to test difference between March–April and December–January returns.
Model Specification
Ordinary Least Squares
The cause-and-effect relationship for March–April and December–January has been investigated using the following equation:
 (2)
(2)
In the first set-up, causation from March to April has been investigated, and in the second one, December to January has been examined. The linear relation between independent and dependent variables has been established with the ordinary least squares (OLS) model.
Analysis and Findings
Descriptive Statistics
The investigation of hypotheses, descriptive statistics and other preliminary assumptions for fitting the models have been detailed in this section. Table 3 shows the descriptive statistics for all 10 sectors’ indices incorporated in the study.
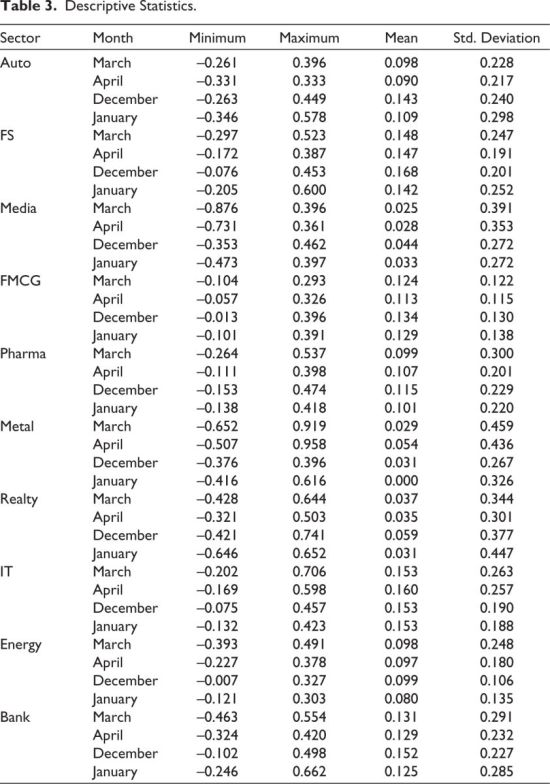
The mean values, standard deviation, and maximum and minimum values during the four months (March, April, December and January) have been presented. The mean average returns and standard deviations have been closely monitored anticipating results from companies in these sectors in the months of March and December. Thereby, the impact of such information from management of companies may be seen in the months of April and January respectively. It has been observed that in the majority of comparisons between March and April returns, negative returns have been presented in April. The exceptions however have been media, metal, pharmaceuticals and IT. The examination further with OLS has been done to explore these observations. Also, standard deviation in few cases, such as auto, financial services, FMCG, media, realty, energy and ban, has been higher in December than in Januaryk. This does not correlate with the higher returns observed in December than in January. Ruling out the possibility of chance factor, further these variables have been investigated with OLS.
ADF Results
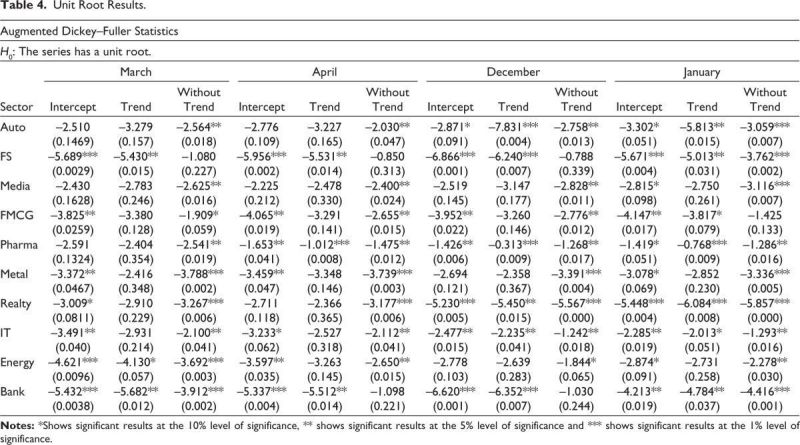
The preliminary assumption for time series modelling remains the check for the unit root, which has been shown in Table 4.
The results have been analysed with intercept, without the presence of any trend for all variables across the 10 sectors. The outcomes in Table 4 reflect that the data have been stationary as the minimum P value is <.05. (Rejection of H0: The series has a unit root.). Thus, the OLS model for testing the financial year and calendar year effects has been successfully carried out.
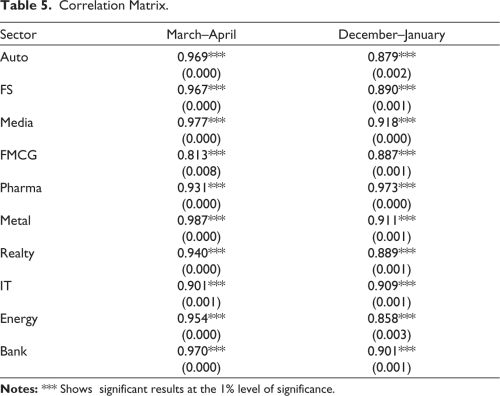
Correlation Results
Table 5 shows the correlation matrix amongst four variables (two groups) taken for investigating the financial year and calendar year effects respectively. It may be observed that the correlation between March–April and December–January has been strong. The P values indicate that these relationships have been significant at the 1% level of significance (H0a: There is no correlation between March and April returns; H0b: there is no correlation between December and January returns). Thus, their connection may be further explored with t-test and other models.
t-Test Results
The independent sample t-test results have been depicted in Table 6.
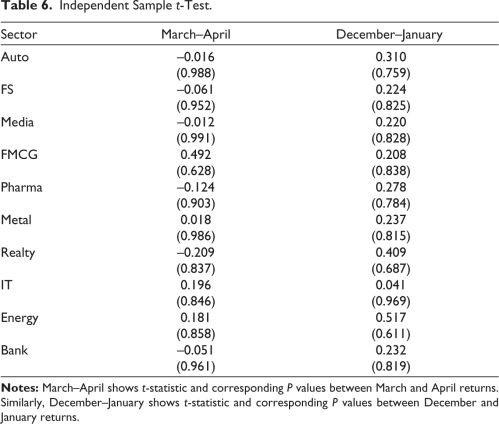
The significant difference between two groups of variables, namely March–April and December–January, has been explored with this test. The results depict that null hypotheses (H0a: there is no significant difference between March and April returns; H0b: there is no significant difference between December and January returns) may not be rejected, with the corresponding P values being >.05 in the case of all sectoral indices. However, as the independent t-test remains a test of a very small order, the relationship between variables has been further tested with the OLS model.
Ordinary Least Squares (Financial Year Cycle)
The regression analysis for the financial year effect (March–April) has been presented in Table 7.
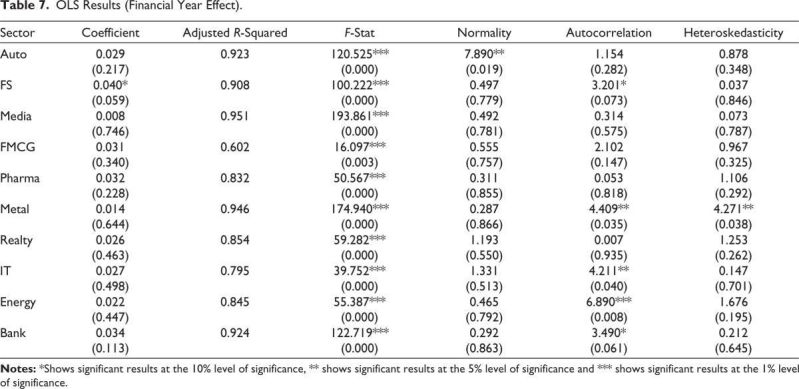
The P values for respective coefficients from sectoral indices have been >.05 in all cases except financial services (H0: There is no significant impact of March returns on April returns). Thereby, results indicate that March returns have impacted April returns significantly in the case of financial service index returns only. All other sectoral indices have experienced similar outcomes meaning that announcements made in March in annual reports have not shown any significant influence on the next month’s returns. The F-statistic values have also been significant at the 5% level of significance, indicating that the model is fitted well. In the Jarque–Bera residual diagnostics, most of the probability values have been >.05 (H0: Residuals are normally distributed) meaning that residuals are normally distributed. Breusch–Godfrey statistics suggests that the P values have been >.05 except in few cases (H0: There is no autocorrelation between residuals of the model). Therefore, the residuals do not have autocorrelation issues. Further, Breusch–Pagan statistics indicates that the P values have been >.05 except in a rare case (H0: There is no heteroskedasticity in residuals of the model). The results indicate that from 2011 to 2023, the financial year effect persisted only for the financial services sector. It may be because this sector connects the entire economy, and reaction in this sector takes time to fade away from the following month’s returns.
Ordinary Least Squares (Calendar Year Cycle)
The calendar year effect (December–January) has been examined with the OLS model and presented in Table 8.
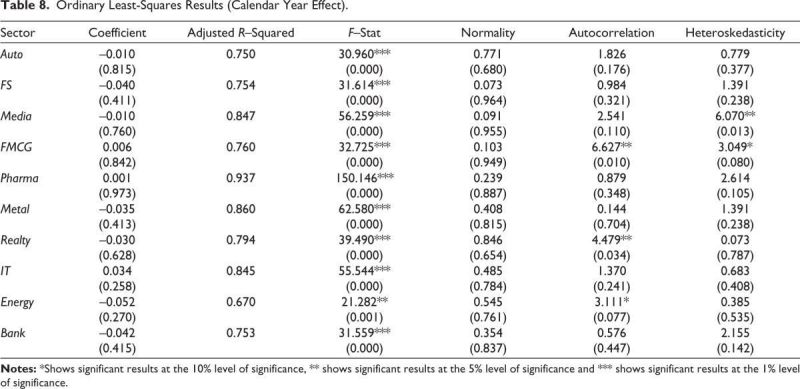
The sector-wise analysis reflected that December returns do not have a significant impact on January returns. Thus, the null hypothesis has been failed to be rejected, with P values >.05 in all the sectors. (H0: There is no significant impact of December returns on January returns.) It may be stated that follow-up reactions in January have not persisted during the period 2011–2023, indicating that national and international shocks have changed the market dynamics. Anomalies may cease to exist due to transparent systems in markets as well as a cautious approach of investors due to the volatile environment in markets and the recent and ongoing events. F-statistic from the model has shown all P values <.05. Hence, the model has been fitted well. The residual diagnostics of the model have shown that residuals have been normally distributed (Jarque–Bera P values > .05; H0: residuals are normally distributed). The autocorrelation P values are also >.05. (H0: There is no autocorrelation among the residuals.) However, heteroskedasticity P values have been >.05. (H0: There is no heteroskedasticity in residuals.) Few cases of residual issues have been there, but in most of the cases, such issues were not present.
Discussion of Results
In the present study, a strong association between March–April and December–January effects has been observed. This result is in line with the study conducted by Singh and Das (2020), Selvakumar (2011) and Gouider et al. (2015). Further, Ferrouhi et al. (2021) found the January and December effects in Botswana in African stock markets. High returns were observed in December and March in the Karachi Stock Exchange and in the Pakistan Stock Exchange respectively (Anjum, 2020). As explained by Shen et al. (2020), the causes behind the January effect were the minimum capital gain and restricted supply of stock, and the desire of investors to sell at premium led to minimise the pressure to sell in January.
In addition, returns of the April month have been affected by March returns. Many researchers found different month’s effect on the Indian stock market, for example, Sen (2014) and Yadav and Singh (2018) found positive return in the months of September and November. In India, the announcement of the interim Union budget is mostly made during February–April, and the closing of the financial year also affects the March–April months. So, the presence of the financial year effect has been significant in the Indian stock market (Saxena et al., 2021; Singh & Das, 2020) as reported in the present study. In contrast, no month anomalies were there in the Indian stock exchange (Ansari, 2020; Bhatia, 2021; Kaur et al., 2019; Kushwah & Munshi, 2018; Nageswari et al., 2011) nor were there Christmas and new year effects (Jain, 2019). In addition, no calendar and financial year effect was noted on the Baltic stock market (Alekneviciene et al., 2021) and on stock exchange indexes in France, Germany, Italy and Spain (Rossi & Gunardi, 2018).
In this study, the December year effect has been prevalent in various sectors, especially in the banking sector. Further, Singh and Das (2020) also mentioned anomalies in the IT and banking sectors of India. Different sectors show different month effects, such as February and August in the NIFTY Bank index; April in the NIFTY Auto index and March in Nifty Financial Services (Saxena et al., 2021). So, the investors can forecast the trend of prices and earn return in different indices of Indian stock markets.
Conclusion and Stakeholders’ Implications
The present study has emphasised on the analysis of two types of prevalent anomalies for the sectoral indices in Indian markets. The results from the independent sample t-test and OLS model have indicated the absence of anomalies during 2011–2023 owing to the absorption of all information in the market prices. It may be concluded from these results that the opportunities from such anomalies have been absent for all indices meaning that information from March and December months may not result in follow-up behaviour in next months. Financial services index has shown rare possibility to explore abnormal returns due to the presence of anomalies in this sector. It may also be added that owing to increasing efficiency of Indian markets in terms of information may be reflected in stock prices leaving lesser scope for traders to utilise volatile stocks.
While planning the proportions in portfolio, investors may pay attention to these sectors and plan, buy and sell strategies. The regulators may keep a watch on corporate disclosures during the months of March and December for avoidance of concentration on any particular sector in markets. Policymakers and managers may lay special emphasis on the shareholders’ wealth during these periods owing to expectations of shareholders from announcements. The absence of anomalies across Indian sectoral indices provides least opportunities for investors and traders to obtain any abnormal returns. Their approach however may be watchful while selecting stocks from these sectors, and events of paramount importance may be studied before investing. A comparative analysis of these particular events may be fruitful in planning investments in a better way.
Scope for Further Study
The study has investigated the financial year and calendar year effects for Indian sectoral indices during 2011–2023. The investigation for anomalies before and after this crisis can be carried out in further studies. The structural breaks may be checked if any analysis for normal and abnormal period may be compared. The examination of other thematic indices from Indian markets and global emerging sectoral indices across the globe can also be explored with the results of the present study.
Declaration of Conflicting Interests
The authors declared no potential conflicts of interest with respect to the research, authorship and/or publication of this article.
Funding
The authors received no financial support for the research, authorship and/or publication of this article.
ORCID iD
Parul Bhatia https://orcid.org/0000-0002-2687-8474
Acharya, P. N., Kaliyaperumal, S., & Mahapatra, R. P. (2022). Capturing the month of the year effect in the Indian stock market using GARCH models. Vilakshan – XIMB Journal of Management, 21(1), 2–14. https://doi.org/10.1108/XJM-08-2021-0204
Adam, K., Marcet, A., & Nicolini, J. P. (2016). Stock market volatility and learning. The Journal of Finance, 71(1), 33–82.
Aleknevičienė, V., Klasauskaitė, V., & Aleknevičiūtė, E. (2021). Behavior of calendar anomalies and the adaptive market hypothesis: Evidence from the Baltic stock markets. Journal of Baltic Studies, 55(2), 187–210. https://doi.org/10.1080/01629778. 2021.1990094
Al-Rjoub, S. A., & Alwaked, A. (2010). January effect during financial crises: Evidence from the US. European Journal of Economics, Finance and Administrative Sciences, 24(24), 29–35.
Al-Saad, K., & Moosa, I. A. (2005). Seasonality in stock return: Evidence from an emerging market. Applied Financial Economics, 15(1), 63–71.
Alvarado, M. G., & Demmler, M. (2019). Analysis of the January effect in time series of Mexican stock market indexes. Mercados y Negocios, 40, 43–62.
Anjum, S. (2020). Impact of market anomalies on stock exchange: A comparative study of KSE and PSX. Future Business Journal, 6(1), 1. https://doi.org/10.1186/s43093-019-0006-4
Ansari, M., & Jafari, H. (2020). The effect of market anomalies on the inefficiency of stock returns. American Journal of Theoretical and Applied Business, 6(3), 23–27. https://doi.org/10.11648/j.ajtab.20200603.12
Ansari, R. U. (2020). Calendar anomalies in IPO valuation: The Indian evidence. Journal of Critical Reviews, 7(14), 2668–3676.
Ariss, R. T., Rezvanian, R., & Mehdian, S. M. (2011). Calendar anomalies in Gulf Cooperation Council stock markets. Emerging Market Review, 12(3), 293–307.
Bankoti, N. (2021). The existence of day of the week effect in Indian stock market. Academy of Marketing Studies Journal, 25(1). https://www.abacademies.org/articles/the-existence-of-day-of-the-week-effect-in-indian-stock-market-9827.html
Bhatia, P. (2021). Spillover effects in the financial year cycle for Indian markets. Asian Journal of Accounting Research, 6(1), 38–54. https://doi.org/10.1108/AJAR-03-2020-0019
Chaker, M. N., & Sabah, A. (2018). Testing the weak form of efficiency of the stock markets in Gulf Cooperation Council countries. Journal Global Business Advancement, 11(3), 376–392.
Chakrabarti, G., & Sen, C. (2007). November effect: An example of calendar anomaly in Indian stock market. West Bengal University of Technology.
Chaudhary, R., Bakhshi, P., & Gupta, H. (2020). The performance of the Indian stock market during COVID-19. Investment Management and Financial Innovations, 17(3), 133–147. https://doi.org/10.21511/imfi
Chen, C. C., Guo, B., & Hung, M. W. (2011). Calendar anomalies and risk factors in the Chinese A-share market. Journal of Banking & Finance, 35(12), 3320–3333.
Chhabra, D., & Gupta, M. (2022). Calendar anomalies in commodity markets for natural resources: Evidence from India. Resources Policy, 79, 103019. https://doi.org/10.1016/j.resourpol.2022.103019.
Choithala, F., & Ajmal, T. K. (2016). December volatility of Indian stock market with the special reference of Bombay Stock Exchange. International Journal of Business Quantitative Economics and Applied Management Research, 3(7), 19–24.
Chordia, T., Goyal, A., & Santa Clara, P. (2012). Long-term return anomalies. The Review of Financial Studies, 25(12), 3962–4012.
Cristi, S., Birau, R., Hawaldar, I. T., & Pinto, P. (2020). The impact of risk anomalies on the pharmaceutical sector of the Indian stock market: A comparative analysis between pharmaceutical, FMCG and IT companies. Revista de Chimie, 71(2), 58–63. https://doi.org/10.37358/RC.20.2.7892
Dash, S., & Mahakud, J. (2015). Market anomalies, asset pricing models, and stock returns: Evidence from the Indian stock market. Journal of Asia Business Studies, 9(3), 306–328.
Debasish, S. S. (2012). An empirical study on month-of-the-year effect in gas oil and refineries sectors in Indian stock market. International Journal of Management and Strategy, 3(5), 1–18.
Deepak, R., & Viswanath, N. S. (2012). Seasonality and sensitivity of NSE NIFTY: An econometric analysis. International Journal of Research in Management Economics and Commerce, 2(11), 202–224.
Elangovan, R., Irudayasamy, F., & Parayitam, S. (2022). Month-of-the-year effect: Empirical evidence from Indian stock market. Asia-Pacific Financial Markets, 29(3), 449–476. https://doi.org/10.1007/s10690-021-09356-2
Engelberg, J., Thompson, L., & Williams, J. (2020). Stock market anomalies and baseball cards. Financial Review, 55(3), 461–479. https://doi.org/10.1111/fire.12223
Engle, R. F., Lilien, D. M., & Schiller, R. J. (1990). Estimating stock volatility in the presence of heteroscedasticity. The Econometrica Journal of the Econometric Society, 58(6), 1029–1052.
Faisal, N., & Majid, M. S. A. (2016). Re-examination of calendar anomalies in the Indonesian stock market. Journal of Applied Economic Sciences, 11(8), 1714–1723.
Fama, E. (1965a). The behavior of stock market prices. Journal of Business, 38(1), 34–105.
Fama, E. (1965b). Random walks in stock market prices. Financial Analysts Journal, 21(5), 55–9.
Ferrouhi, E. M., Kharbouch, O., Aguenaou, S., & Naeem, M. (2021). Calendar anomalies in African stock markets. Cogent Economics & Finance, 9(1), 1978639. https://doi.org/ 10.1080/23322039.2021.1978639
Floros, C. (2008). The monthly and trading month effects in Greek stock market returns: 1996–2002. Managerial Finance, 34(7), 453–464.
Floros, C., & Salvador, E. (2014). Calendar anomalies in cash and stock index futures: International evidence. Economic Modelling, 37(3), 216–223.
Gouider, J. J., Kaddour, A., & Azza, H. (2015). Stock market anomalies: Case of calendar effects on the Tunisian stock market. Global Journal of Management and Business Research, 15(2), 27–37.
Guo, L. Li, F. W., & Wei, K. C. J. (2020). Security analysts and capital market anomalies. Journal of Financial Economics, 137(1), 204–230.
Haug, M., & Hirschey, M. (2006). The January effect. Financial Analysts Journal, 62(5), 78–88. https://doi.org/10.2469/faj.v62.n5.4284
Hiremath, G. S., & Kumari, J. (2014). Stock returns predictability and the adaptive market hypothesis in emerging markets: Evidence from India. Springer Plus, 3(1), 428. https://doi.org/10.1186/2193-1801-3-428
Iqbal, M. S., Kouser, R., & Azeem, M. (2013). Conventional and Islamic anomalies in Karachi Stock Exchange. Science International, 25(4), 999–1007.
Ito, M., & Sugiyama, S. (2009). Measuring the degree of time varying market inefficiency. Economics Letters, 103(1), 62–64.
Izzeddien, N. A. (2021). Investigating the efficiency of financial markets: Empirical evidence from MENA countries. Investment Management and Financial Innovations, 18(1), 250–259. https://doi.org/10.21511/imfi.18(1).2021.21
Jain, V. (2019, December 30). Empirical evidence on the existence of calendar anomalies in the market for gold and crude oil [Conference session]. 2nd International Conference on Information Systems and Management Science (ISMS), Computer Science Research Network, Tripura University, Agartala.
Kamstra, M., Wermers, R., & You, X. (2002). Exploring the unexplained variation in return. The Journal of Finance, 57(2), 661–720.
Karolyi, G. A., & Rao, V. B. (2015). Market anomalies in emerging markets. Emerging Markets Review, 21, 1–23.
Kaur, H. (2004). Time varying volatility in the Indian stock market. Vikalpa, 29(4), 25–42.
Kaur, M., Jaisinghani, D., & Ramalingam, M. (2019). Do seasonal anomalies still persist? Empirical evidence post-global financial crisis. The Journal of Contemporary Issues in Business and Government, 25(1), 44–65.
Kaushik, S., & Nagarkar, J. (2023). Seasonality index in different asset classes in India. AIP Conference Proceedings, 2523(1), 030019. https://doi.org/10.1063/5.0110536
Khan, M. I., Khan, M. S., & Khan, A. (2014). Calendar anomalies reality or an illusion? KSE-Pakistan. Journal of Economics and International Finance, 6(4), 80–84, https://doi.org/10.5897/JEIF2013.0488
Kim, J. H., Shamsuddin, A., & Lim, K. P. (2011). Stock return prdictability and the adaptive market hypothesis: Evidence from century long US data. Journal of Empirical Finance, 18(5), 868–879.
Kumar, H., & Dawar, M. (2017). Seasonality in the Indian stock markets: A study of calendar effects. MUDRA: Journal of Finance and Accounting, 4(1), 1–19.
Kushwah, S., & Munshi, S. (2018). The effect of seasonality over stock exchanges in India. Amity Journal of Management, 6(2), 46–53.
Lodha, S., & Soral, G. (2015). Seasonal patterns in Indian stock markets: An application of GARCH (1, 1) model. American International Journal of Research in Humanities, Arts and Social Sciences, 9(1), 33–43.
Li, W., Nor, N. M., Hisham, M., & Min, F. (2023). Volatility conditions and the weekend effect of long-short anomalies: Evidence from the US stock market. Quantitative Finance and Economics, 7(2), 337–355. https://doi.org/10.3934/QFE.2023016
Li, W., Zhu, Q., Wen, F., Nor, N. M. (2022). The evolution of day-of-the-week and the implications in crude oil market. Energy Economics, 106, 105817. https://doi.org/ 10.1016/j.eneco.2022.105817
Li, Y., Liu, Q., Miao, D., & Tse, Y. (2024). Return seasonality in commodity futures. International Review of Economics & Finance, 93(Part B), 448–462.
Lim, K. P., Brooks, R. D., & Hinich, M. J. (2008). Nonlinear serial dependence and the weak-form efficiency of Asian emerging markets. Journal of International Financial Markets, Institutions and Money, 18(5), 527–544.
Meek, A. C., & Hoelscher, S. A. (2023). Day-of-the-week effect: Petroleum and petroleum products. Cogent Economics & Finance, 11(1), 2213876. https://doi.org/10.1080/23322039.2023.2213876
Musnadi, S., Faisal, & Majid, M. S. A. (2018). Overreaction and underreaction anomalies in the Indonesian stock market: A sectoral analysis. International Journal of Ethics and Systems, 34(4), 442–457. https://doi.org/10.1108/IJOES-12-2017-0235
Nageswari, P., & Rani, P. D. L. (2018). An empirical analysis on seasonal anomalies in BSE sectoral indices. Research Bulletin, 34(4), 1–18.
Nageswari, P., Selvam, M., & Gayathri, J. (2011). An empirical analysis of semi month and turn of the month effects in Indian stock market. International Journal of Research in Commerce, Economics & Management, 1(3).
Nageswari, P., Selvam, M., Vanitha, S., & Babu, M. (2013). An empirical analysis of January anomaly in the Indian stock market. International Journal of Accounting and Financial Management Research, 3(1), 177–186.
Neeraja, P., & Srikanth, P. (2014). Anomalies in Indian stock market: An empirical evidence from seasonality effect on BSEIT Index. International Journal of Arts Management, 5(3), 109–116.
Noda, A. (2012). A test of the adaptive market hypothesis using non-Bayesian time-varying AR model in Japan. Financial Research Letter, 17(C), 66–71.
Parikh, A. (2009, January 1). The December phenomenon: Month-of-the-year effect in the Indian stock market. NSE News.
Patel, J. B. (2014). The monthly barometer of the Indian stock market. International Business and Economics Research Journal, 13(1), 85–92.
Pathak, M. R. (2013). Stock market seasonality: A study of the Indian stock market (NSE). Paripex-Indian Journal of Research, 2(3), 200–202.
Perumal, N., Selvam, M., & Venkateswar, S. (2013). Calendar anomalies in BSE Sensex Index returns in post rolling settlement period. International Journal of Finance and Accounting, 2(8), 406–416.
Prabhu, G. V. (2014). An analytical study on seasonal anomalies of ten Sensex listed stocks from the time period 2006 (February) to 2014 (February). Journal of Management Research, 31(1), 144–151.
Purohit, H., & Tyagi, P. (2015). Calendar effects in stock markets of India and China: An empirical analysis of month of-the-year effect. Business Analyst, 36(1), 69–81.
Qadan, M., Aharon, David Y., & Eichel, R. (2021). Seasonal and calendar effects and the price efficiency of cryptocurrencies. Finance Research Letters, 46(Part A), 102354.
Rosini, L., & Shenai. (2020). Stock returns and calendar anomalies on the London Stock Exchange in the dynamic perspective of the Adaptive Market Hypothesis: A study of FTSE100 & FTSE250 indices over a ten-year period. Quantitative Finance and Economics, 4(1), 121–147.
Rossi, M., & Gunardi, A. (2018). Efficient market hypothesis and stock market anomalies: Empirical evidence in four European countries. The Journal of Applied Business Research, 34(1), 183–192.
Sadia, A. (2020). Impact of market anomalies on stock exchange: A comparative study of KSE and PSX. Future Business Journal, 6(1), 1–11.
Sarbapriya. (2012). Investing seasonal behaviour in the monthly returns: Evidence from BSE Sensex of India. Advances in Asian Social Science, 2(4).
Sawitri, N., & Astuty, P. (2018). Market anomalies and effect on return. European Research Studies Journal, 21(2), 630–649.
Saxena, S., Purohit, H., & Malhotra, N. (2021). Diminishing calendar anomalies: Case of Indian equity markets. Global Business and Economics Review, 24(1), 43–58.
Selvakumar, D. S. (2011). Existence of certain anomalies in Indian stock market [Conference paper, pp. 498–504]. Proceedings of International Conference on Economic and Finance Research, School of Social Science, VIT University.
Sen, S. S. (2014). The month-of-the-year effect in Indian stock market. A case study on BSE Sensex. International Journal of Marketing and Business Communication, 3(2), 16–27.
Shahid, M. N., & Sattar, A. (2017). Behavior of calendar anomalies, market conditions and adaptive market hypothesis: Evidence from Pakistan stock exchange. Pakistan Journal of Commerce and Social Sciences, 11(2), 471–504.
Shen, Y., Hung, C., Chiou, J., & Shen, K. (2020). The January effect and prospect theory in Taiwan. Emerging Markets Finance and Trade, 56(5), 1113–1123. https://doi.org/ 10.1080/1540496X.2019.1598367
Singh, S., & Das, C. (2020). Calendar anomalies in the banking and IT index: The Indian experience. Asian Economic and Financial Review, 10(4), 439–448. https://doi.org/ 10.18488/journal.aefr.2020.104.439.44
Sriram, M., & Devi, P. R. (2013). Seasonality in the returns: A study of BSE Sensex. International Journal of Financial Management, 3(1), 60–69.
Sudarvel, J., & Velmurugan, R. (2015). January effect in Indian banking sector with reference to BSE bank index. International Journal of Management Research and Reviews, 5(11), 1066–1071.
Sudha, G., Sornaganesh, V., & ThangajesuSathish, M. (2020). Impact of Indian stock market due to crisis in March 2020. International Journal of Multidisciplinary Educational Research, 9(6), 128–132.
Tadepalli, M. S., & Jain, R. K. (2018). Persistence of calendar anomalies: Insights and perspectives from literature. American Journal of Business, 33(1/2), 18–60. https://doi.org/10.1108/AJB-08-2017-0020
Urquhart, A., & Hudson, R. (2013). Efficient or adaptive markets? Evidence from major stock markets using very long-run historic data. International Review of Financial Analysis, 28, 130–142.
Urquhart, A., & McGroarty, F. (2014). Calendar effects, market conditions and the adaptive market hypothesis: Evidence from long-run US data. International Review of Financial Analysis, 35(3), 154–166.
Verma, A., & Kumar, C. V. R. S. V. (2012). Month effect in the Bombay stock market. International Journal of Engineering and Management Research, 2(5), 1–9.
Wong, W. K., Agrawal, A., & Wong, T. N. (2006). The disappearing calendar anomalies in the Singapore stock exchange market. Lahore Journal of Economics, 11(2), 123–139.
Yadav, S. H., & Singh, S. (2018). Calendar anomaly: Unique evidence from the Indian stock market. Journal of Advances in Management Research, 15(1), 87–108.
Yadav, S. P. (2013). Calendar anomaly in Indian stock market with respect to empirical study of quarter-of-the-year effect, month-of-the-year effect, day-of-the-week effect on NIFTY for the years Jan. 1996–Mar. 2013. Vishwakarma Business Review, 3(2), 76–85.
