Review of Professional Management

 Search

Aisha Badruddin1
1Department of Business Management, Integral Business School, Integral University, Lucknow, Uttar Pradesh, India

Creative Commons Non Commercial CC BY-NC: This article is distributed under the terms of the Creative Commons Attribution-NonCommercial 4.0 License (http://www.creativecommons.org/licenses/by-nc/4.0/) which permits non-Commercial use, reproduction and distribution of the work without further permission provided the original work is attributed.
The research aims to evaluate the business models of microfinance institutions (MFIs). The major research question is as to what the performance of the MFI Business Model in India was during the COVID-19 situation. The secondary data from 2018 to 2021 is taken across the legal form of MFIs operating all over India. The variables studied include gross loan portfolio (GLP), operating expense ratio (OER), capital adequacy ratio (CAR), finance cost ratio (FCR), active borrower per credit officer (ABCO), return on assets (ROA), return on equity (ROE), YIELD, debt-to-equity ratio (DER) and active borrowers (AB). The statistical technique implemented in the research includes Kolmogorov-Smirnov, Shapiro-Wilk and Levene statistic for testing normality and homogeneity, one-way ANOVA and post-hoc multiple comparisons. The NBFC-MFI (Non-Banking Financial Company-Microfinance Institution) business model is found to be performing well as far as the value creation is concerned. On other dimensions of business model evaluation, that is, value deliverance and value capture, business models of all the categories of MFIs are similar. The result reveals status of business model on value creation, deliverance and capture dimensions during COVID-19.
Business models, legal forms, value creation, value deliverance, value capture, NBFC-MFI and COVID-19
Abbreviations
AB: Active borrowers
ABCO: Active borrower per credit officer
ANOVA: Analysis of variance
BRICS: Brazil Russia India China South Africa
CAR: Capital adequacy ratio
COVID-19: Coronavirus disease-2019
DER: Debt-to-equity ratio
FCR: Finance cost ratio
GLP: Gross loan portfolio
JLG: Joint liability group
MFI: Microfinance institution
NABARD: National Bank for Agriculture and Rural Development
NBFC: Non-banking financial company
NBFC-MFI: Non-banking financial company-microfinance institution
NGO: Non-governmental organisation
OER: Operating expense ratio
ROA: Return on assets
ROE: Return on equity
RRBs: Regional rural banks
SEC.8CO.: Section 8 company
SHG: Self-help group
YIELD: Yield on portfolio
Introduction
The COVID-19 pandemic exposed the financial fragility of businesses globally, particularly smaller ones, due to sharp cash flow disruptions from lockdowns (Brown & Rocha, 2020). No sector or economy was spared, including microfinance, where microfinance institutions (MFIs) saw major operational setbacks. Loan collections plummeted in April–May 2020, with a modest recovery beginning in June. By Q3, the sector showed signs of rebound, yet many small and medium MFIs faced acute liquidity crises. Despite national efforts, full crisis control remained elusive. As FY 2020 ended, MFI clients’ livelihoods began recovering. MFIs must support this recovery while addressing their liquidity stress. The pandemic has brought critical lessons, urging MFIs to be more client-centric. Strong client relationships are essential, as cooperation post-crisis depends on trust. Encouragingly, most MFIs have shown patience and empathy toward clients’ challenges despite their own financial constraints. COVID-related losses led to higher credit costs for most MFIs. Additionally, the cost of funds rose due to increasing interest rates in the country (Nandi et al., 2023).
The microfinance sector in India comprises various legal forms, including Non-Banking Financial Companies (NBFC-MFIs), Section 8 Companies, Societies & Trusts and Cooperatives. These institutions cater to low-income borrowers through diverse lending models such as self-help groups (SHGs) and joint liability groups (JLGs). The pandemic-induced economic downturn tested the sustainability of these business models, necessitating an evaluation of their value creation, deliverance and capture capabilities.
Research Objectives
The study aims to assess the performance of MFI business models in India across three dimensions:
Literature Review
Business Model Dimensions
Teece (2010) defines a business model as how an organisation delivers value and earns profit. Rappa (2010) sees it as a method for sustaining operations through revenue generation, explaining how a firm profits based on its position in the value chain. Osterwalder and Pigneur (2009) describe it as the rationale behind how a firm creates, delivers and captures value. Frank (2008) views production as transforming inputs into outputs or utility. Watson (2005) adds that a business model encompasses all organisational activities that incur costs and create customer value. Afuah (2003) identifies four profitability determinants: industry factors (competition, barriers, clients), resources (value creation), cost (low-cost model) and positioning (finding a unique market space). Together, these elements shape an effective and competitive business model. The analysis on service quality among MFIs indicates a significant disparity across the dimensions of tangibility, reliability, responsiveness, assurance and empathy (Badruddin, 2024). Therefore, it is essential to identify the most impactful business model of MFIs.
Understanding Business Models in Microfinancing
Definition of Microfinance
Nandi et al. (2018) define microfinance as the provision of small-scale thrift, credit and financial services to the poor in rural, semi-urban, or urban areas to enhance income and living standards. Microfinance Gateway views it as financial services for low-income earners, aiming for permanent access to quality, affordable services to fund income-generating activities, stabilise consumption and mitigate risks. Initially linked to microcredit, it now includes savings, insurance, payments and remittances. Asian Development Bank (2000) defines it as a range of financial services—deposits, loans, transfers and insurance—for small enterprises and households. CGAP (2009) describes it as a credit method using collateral substitutes to deliver and recover short-term loans to micro-entrepreneurs. Nandi et al. (2018) identify MFIs as non-bank institutions offering microfinance. MicroRate (2014) proposes a tier system based on institutional maturity using three indicators: sustainability return on assets (ROA), size (total assets) and transparency (regulation/reporting level).
Microfinance Business Models
Srinivas (2015) identified 14 microfinance models across India, Thailand, the Philippines, Indonesia and Sri Lanka through literature review, fieldwork and interviews. These include associations, bank guarantees, community banking, cooperatives, credit unions, Grameen, group and individual lending, intermediaries, NGOs, peer pressure, ROSCAs, small business and village banking models. Most MFIs adopt elements from multiple models, many of which are formalised versions of informal financial systems. Badruddin and Anees (2018) conducted ratio analysis to assess the outreach and portfolios of small, medium and large NBFC-MFIs. MFIs are classified based on Gross Loan Portfolio (GLP) as per MFIN. Ratio analysis shows smaller MFIs face greater challenges, especially in debt funding, as reflected in their higher debt-to-equity ratios (DER). However, operating self-sufficiency benefits all MFI categories. Kumar (2015) studied SHG Federations in five states and found that federation SHGs performed better in financial management than non-federated ones. Both types were similar in general management practices like meeting frequency, participation and awareness. However, non-federated SHGs showed better governance and record-keeping. Batra and Sumanjeet (2012) noted that while government-led SHG microfinance initiatives are promising, they have gaps and must focus on expanding outreach to the lowest income groups.
Banks, RRBs, cooperatives and NGO-linked SHGs are key players in microfinance. Focus should be on three inclusive growth strategies: scaling quality financial services to reach large populations, targeting the lowest income segments, and reducing costs for clients and providers. Kanayi (2009) found that MFIs typically follow a three-tier structure—Field Officer, Branch and Head Office. He highlighted innovative models such as Mexico’s corner shop banking for basic services and the rise of Islamic microfinance, blending microfinance with Islamic finance, especially in South Asia, the Middle East and Africa. He also noted that diverse entities—insurance firms, money exchanges, mobile operators, property developers and retail shops—alongside NGOs, banks and NBFCs, are increasingly delivering microfinance services. El Gamal et al. (2014) suggested an alternative microcredit model built on the Rotating Savings and Credit Association (ROSCA) model (which does not involve interest rate payments), but with payments of individual borrowers guaranteed by a bank for a fee. In a laboratory experiment in rural Egypt, they find that this model attracts more clients than the traditional Grameen group lending model. Thus, it can be used to expand microfinance in Islamic countries also.
Issues and Challenges
EDA Rural Systems Pvt. Ltd. (2005), in a SIDBI-sponsored study of 20 MFIs across SHG, Grameen and Individual Banking/cooperative models, observed a perceived trade-off between outreach to the poor and operational self-sufficiency. Individual Banking MFIs showed high self-sufficiency but low outreach depth, while SHG and Grameen MFIs demonstrated broader outreach. Notably, two SHGs and two Grameen MFIs achieved both sustainability and significant outreach. Badruddin (2017) examined fintech advancements, highlighting the role of technology in microfinance delivery, key distribution tools for financial inclusion and related challenges. The transition from traditional institutions to mobile/e-banking enhances outreach. Uddin et al. (2022) noted that systemic business risk may limit MFIs’ services to the poor, but effective asset-liability monitoring with donor funds can mitigate this. Collaboration between banks and MFIs supports SDG achievement and promotes financial inclusion.
Research Gap
The literature review indicates that while global studies explore various microfinance models, few focus on business models. In India, most analyses compare SHGs and JLGs, with some attention to the Grameen model. However, no study examines MFIs’ business models across legal forms using the dimensions of value creation, delivery and capture.
Contribution and Motivation
This research contributes to the existing literature by analysing business models beyond traditional SHG and JLG frameworks. Unlike previous studies that focus solely on financial sustainability, this study incorporates business model dimensions that address financial viability and social impact. The findings are expected to inform policymakers, practitioners and MFIs on best practices for enhancing financial inclusion in the post-pandemic era.
Research Methodology
This section of the article focuses on the research design based on the identification of variables, development of hypotheses depending upon the variables identified, and the statistical tools utilised in the research.
Variables Identification and Hypotheses Development
The study adopts the definition by Osterwalder and Pigneur (2009): ‘A business model describes the rationale of how an organisation creates, delivers and captures value’. The three aspects explored are: (a) How an organisation creates value: Value creation focuses on offering a value proposition tailored to a customer segment’s needs. For MFIs, this involves women’s empowerment through financial inclusion by providing collateral-free microloans. Proxies for value creation include the number of active borrowers (ABs) and GLP. (b) How an organisation delivers value: MFIs distinguish themselves by offering doorstep financial services, primarily through credit officers who reach borrowers. Alongside credit delivery, they provide financial education and training for income-generating activities. Delivery channel effectiveness is assessed using proxies such as capital adequacy ratio (CAR) and DER (financing structure), active borrowers per credit officer (ABCO) (staff productivity), finance cost ratio (FCR) (expense ratio) and operating expense ratio (OER) (operational efficiency). (c) How an organisation captures value: MFIs generate recurring revenues through interest income and fees for delivering value or customer support. Value capture is measured using ROA and return on equity (ROE) (overall performance) and YIELD on the loan portfolio (revenue stream). Secondary data from Nandi et al. (2019, 2020) covers various MFIs in India, including NBFC-MFIs, Section 8 Companies, Societies & Trusts and Cooperatives.
The variables undertaken for study are GLP, OER, CAR, FCR, ABCO, ROA, ROE, YIELD, DER and AB.
Selection of Variables
The variables selected for this study align with critical performance indicators for MFIs as reported by Sa-Dhan (Nandi et al., 2022):
Time Period Selection
The study period (2018–2021) covers pre-pandemic, peak-pandemic and recovery phases. While more recent data is available, this timeframe offers a comparative analysis of the business model performance before and during COVID-19.
Post-COVID Challenge
The pandemic exposed MFIs to new risks, including higher default rates, reduced liquidity and shifts in borrower behaviour. Post-pandemic recovery strategies, such as digital transformation and regulatory interventions by NABARD and RBI, have been crucial in stabilising the sector.
Research Questions
The major research question that needs to be dealt with is: What is the performance of the MFI Business Model in India during COVID-19? Therefore, the research questions framed under various variables to be answered constitute the following question: Is there a significant difference in GLP, OER, YIELD, FCR, ROA, ROE and AB across categories of MFIs?
Formulation of Hypotheses
The alternate hypotheses are formulated as follows:
H1: There is a significant difference in GLP across categories of MFIs.
H2: There is a significant difference in OER across categories of MFIs.
H3: There is a significant difference in YIELD across categories of MFIs.
H4: There is a significant difference in CAR across categories of MFIs.
H5: There is a significant difference in DER across categories of MFIs.
H6: There is a significant difference in FCR across categories of MFIs.
H7: There is a significant difference in ABCO across categories of MFIs.
H8: There is a significant difference in ROA across categories of MFIs.
H9: There is a significant difference in ROE across categories of MFIs.
H10: There is a significant difference in AB across categories of MFIs.
Statistical Tools
The study employs a range of statistical methods tailored to meet its research objectives. To assess the normality of the data distribution, both the Kolmogorov-Smirnov and Shapiro-Wilk tests are applied. Levene’s test is used to evaluate the homogeneity of variances among groups. For comparing different business models, a one-way ANOVA is conducted, followed by Tukey’s Honestly Significant Difference (HSD) test to perform post-hoc analysis and identify specific group differences.
Data Analysis, Findings and Interpretation
Tests of Normality
To test the normality hypothesis, the Kolmogorov-Smirnov and Shapiro-Wilk tests are applied. The p value must be greater than .05 to meet the normality assumption. The GLP, AB and FCR were transformed using a log transformation in order to meet the normality assumption. The normality tests for each variable provide insight into whether the data follows a normal distribution in Table 1. For GLP, both the Kolmogorov-Smirnov and Shapiro-Wilk tests yield significance values above 0.05 (0.200 and 0.088, respectively), indicating that the data likely conform to a normal distribution. AB shows similar results, with both tests producing high significance values (0.200 for both), also suggesting normality. In contrast, FCR has a Shapiro-Wilk significance value of 0.047, which is below the 0.05 threshold, implying that its data may not be normally distributed. ABCO, with significance values of 0.200 (Kolmogorov-Smirnov) and 0.127 (Shapiro-Wilk), appears to follow a normal distribution. OER and YIELD both show strong indications of normality, as evidenced by their high significance levels in both tests. Similarly, CAR and DER meet the assumptions of normality, with Shapiro-Wilk values of 0.600 and 0.940, respectively. The case of ROA is borderline, with a Kolmogorov-Smirnov significance of 0.059 and a Shapiro-Wilk value of 0.101—suggesting a potential deviation from normality, though not a strong one. Lastly, ROE shows a significance level just above the threshold in both tests (0.053 and 0.451), indicating mild deviation from normality, but not conclusively so. Overall, most variables appear to be normally distributed, with the possible exceptions of FCR and, to a lesser extent, ROA and ROE.
Table 1. Test of Normality.
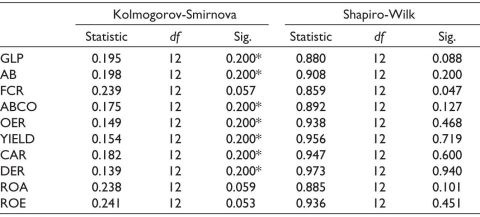
Note: *This is a lower bound of the true significance.
Test of Homogeneity of Variances
The Levene’s test results in Table 2 evaluate the assumption of homogeneity of variances, which is important in ANOVA to ensure that the variances across groups are equal. A significance (sig.) value less than 0.05 indicates that the variances are not equal (i.e., the assumption of homogeneity is violated), while a value above 0.05 suggests the variances are homogeneous. The results depict that GLP has a Levene statistic of 6.305 with a significance value of 0.017, and AB shows a statistic of 10.888 with a sig. of 0.003. Both values are below the 0.05 threshold, indicating that the assumption of equal variances is violated for these two variables—the group variances differ significantly. For all other variables—FCR (0.184), OER (0.420), YIELD (0.187), CAR (0.708), DER (0.124), ABCO (0.183), ROA (0.864) and ROE (0.926)—the significance values are above 0.05. This means that the assumption of homogeneity of variances holds for these variables, and the differences in group variances are not statistically significant.
Table 2. Test of Homogeneity of Variances.
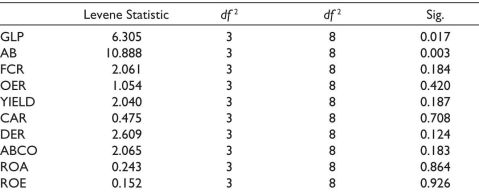
In summary, Levene’s test results suggest that most variables meet the homogeneity assumption necessary for ANOVA, with the exception of GLP and AB, where group variances differ significantly and may require alternative statistical approaches or corrections (e.g., Welch’s ANOVA) for accurate analysis.
One-way ANOVA
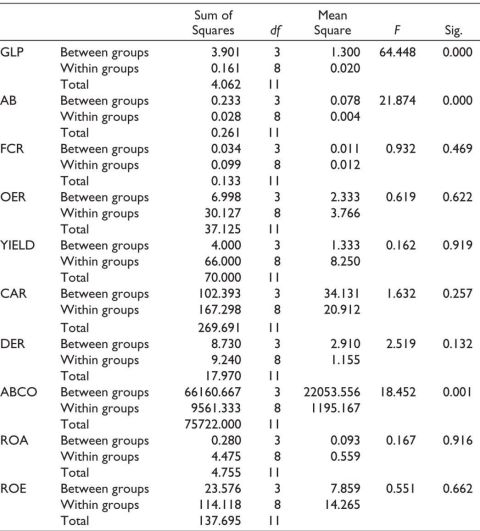
Table 3 shows that the assumption of normality and homogeneity is satisfied, so one-way ANOVA is used. From the table, it is seen that sig < 0.05. Hence, the null hypotheses are not accepted in case GLP, ABCO and AB. The null hypothesis is accepted in case of OER, CAR, FCR, ABCO, ROA, ROE, YIELD and DER as the sig > 0.05. The ANOVA results provide a detailed analysis of each variable to determine whether significant differences exist between the groups. For the GLP variable, the between-groups sum of squares (SS) is 3.901 with 3 degrees of freedom (df), resulting in a mean square (MS) of 1.300 and an F-value of 64.448. The significance level (sig.) is 0.000, indicating a statistically significant difference among the groups. Similarly, AB shows a between-groups SS of 0.233, df of 3, MS of 0.078 and F-value of 21.874, with a sig. value of 0.000, also pointing to a significant difference. In contrast, FCR has a sig. value of 0.469, which is above the 0.05 threshold, suggesting no significant difference between the groups. The same applies to OER (sig. = 0.622), YIELD (0.919), CAR (0.257), DER (0.132), ROA (0.916) and ROE (0.662), all of which do not show statistically significant differences. However, ABCO stands out with a between-groups SS of 66,160.667, MS of 22,053.556, F-value of 18.452 and sig. value of 0.001, confirming a significant difference across groups. Overall, the ANOVA analysis reveals that the variables GLP, AB and ABCO exhibit significant variation among the groups, indicating different group behaviours, whereas the other variables suggest similarity across groups.
Table 3. ANOVA.
Post-hoc Multiple Comparison-Tukey HSD
The multiple comparison shows the analysis across different business models of MFIs on the dimensions of value creation, value deliverance and value capture in the purview of variables undertaken against each dimension.
Value Creation
The variable GLP and AB show multiple comparisons of value creation dimension of business model. The result of analysis of these variables follows below:
Table 4. GLP and AB-multiple Comparisons-Tukey HSD.
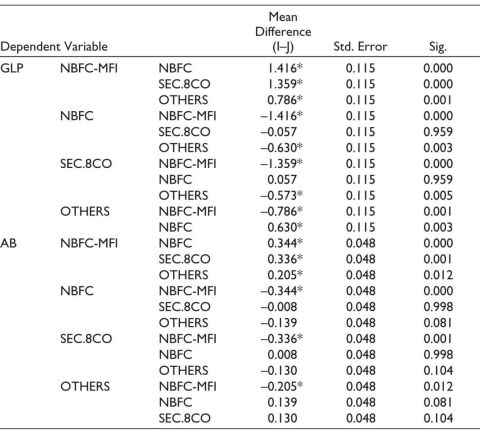
Note: *The mean difference is significant at the 0.05 level.
Value Deliverance
The variables FCR, OER, ABCO, CAR and DER show multiple comparisons of value deliverance dimension. The result of the analysis of these variables follows below:
Table 5. FCR, OER, CAR, DER & ABCO-multiple Comparisons-Tukey HSD.
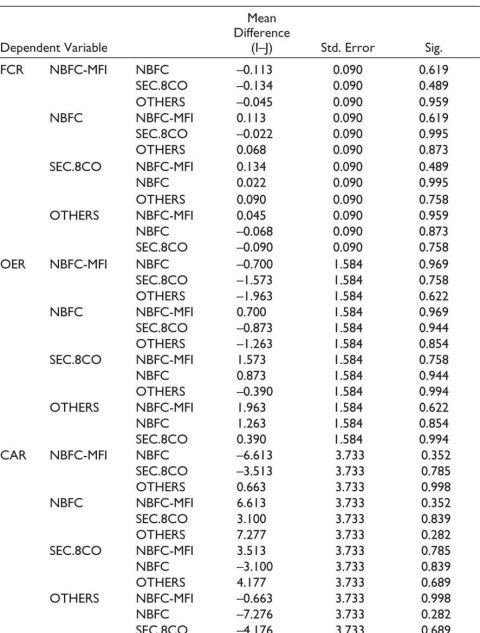
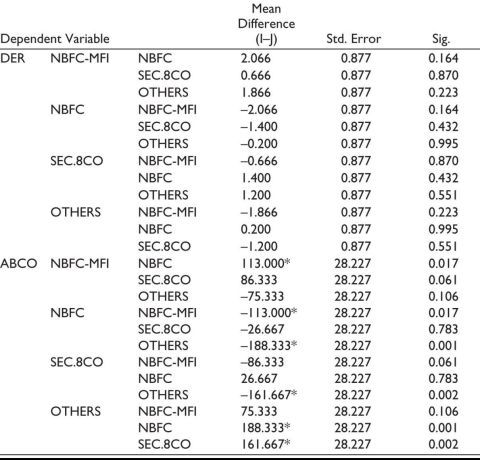
Note: *The mean difference is significant at the 0.05 level.
Value Capture
The variables ROA, ROE and YIELD show multiple comparisons of value capture dimension of business model. The result of the analysis of these variables follows below:
Table 6. ROA, ROE& YIELD-multiple Comparisons-Tukey HSD.
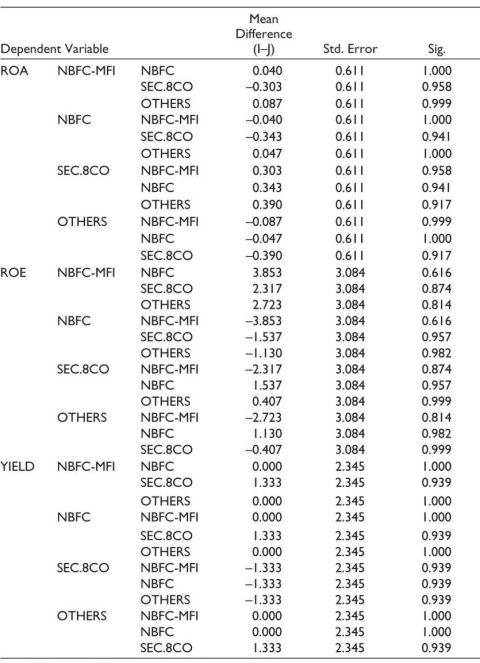
Note: *The mean difference is significant at the 0.05 level.
Summary of Findings
The results (Table 1: Normality & Table 2: Homogeneity of variances) confirm data suitability for ANOVA analysis. The analysis finds significant differences exist for GLP and AB (value creation), as shown in Table 3. Other variables show uniform trends across MFI categories. The results of the analysis in Table 4,Table 5 and Table 6 show multiple comparisons revealing that:
Conclusion and Recommendations
Other MFIs—NBFCs, Section 8 Companies and OTHERS—are advised to improve GLP, ABCO, FCR, DER, CAR, ROE, ROA, OER, YIELD and AB to enhance their performance in value creation, delivery and capture.
.png) 29 lakh in bank credit, 1992) to 67.40 lakh (1.51 lakh crore), and JLGs from 285 (447 lakh, 2005) to 188 lakh (3.27 lakh crore). NABARD has led the SHG movement by offering policy support, training, capacity building and refinancing for SHG loans. Initiatives include simplified account opening procedures, relaxed collateral norms, the 1993 Bulk Lending Scheme, support for SHG promotion, livelihood training, research and awareness programmes (Status of Microfinance, 2020–2021).
29 lakh in bank credit, 1992) to 67.40 lakh (1.51 lakh crore), and JLGs from 285 (447 lakh, 2005) to 188 lakh (3.27 lakh crore). NABARD has led the SHG movement by offering policy support, training, capacity building and refinancing for SHG loans. Initiatives include simplified account opening procedures, relaxed collateral norms, the 1993 Bulk Lending Scheme, support for SHG promotion, livelihood training, research and awareness programmes (Status of Microfinance, 2020–2021).Policy Implications
Limitations of the Study
The current study is based on the COVID-19 period, which restricts its scope in analysing long-term changes in MFIs’ business models and their post-pandemic recovery strategies.
Future Research Directions
Future research could focus on:
Declaration of Conflicting Interests
The author declared no potential conflicts of interest with respect to the research, authorship and/or publication of this article.
Funding
The author received no financial support for the research, authorship and/or publication of this article.
ORCID iD
Aisha Badruddin https://orcid.org/0000-0002-4415-4808
Afuah, A. (2003). Business models: A strategic management approach. McGraw-Hill/Irwin.
Asian Development Bank. (2000). Microfinance policy. Retrieved, 22 January 2023, from http://www.adb.org/documents/policies/microfinance/microfinance0100.asp?p= policies
Badruddin, A. (2017). Conceptualization of the effectiveness of fintech in financial inclusion. International Journal of Engineering Technology Science and Research, 4(7), 960–965.
Badruddin, A. (2024). Measuring service quality of selected microfinance institutions: A gap score analysis.
Badruddin, A., & Anees, M. (2018). An evaluative study of NBFC-MFIs in India. International Journal of Engineering Technology Science and Research, 5(3), 941–947.
Batra, V., & Sumanjeet. (2012). The state of microfinance in India: Emergence, delivery models and issues. https://ideas.repec.org/p/aiu/abewps/37.html
Brown, R., & Rocha, A. (2020). Entrepreneurial uncertainty during the Covid-19 crisis: Mapping the temporal dynamics of entrepreneurial finance. Journal of Business Venturing Insights, 14, e00174. https://doi.org/10.1016/j.jbvi.2020.e00174.
CGAP. (2009, June 5). What is microfinance. Retrieved, 18 May 2016, from http://microfinance.cgap.org/2009/06/05/what-is-microfinance
EDA Rural Systems Pvt Ltd, & SIDBI. (2005, June). The maturing of Indian microfinance: Findings and policy implications from a national study. https://www.findevgateway.org/sites/default/files/publications/files/mfg-en-paper-the-maturing-of-indian-microfinance-findings-and-policy-implications-from-a-national-study-jun-2005.pdf
El Gamal, M., ElKomi, M., Karlan, D., & Osman, A. (2014). Bank-insured ROSCA for microfinance: Experimental evidence in poor Egyptian villages. Journal of Economic Behavior & Organization, 103(Suppl), S56–S73.
Frank, R. H. (2008). Microeconomics and behaviour (7th ed.). McGraw-Hill International.
Hewa-Wellalage, N., Boubaker, S., Hunjra, A. I., & Verhoeven, P. (2022). The gender gap in access to finance: Evidence from the COVID-19 pandemic. Finance Research Letters, 46(A), 102329. https://doi.org/10.1016/j.frl.2021.102329
Kanayi, A. (2009). Emerging trends in the microfinance industry. Finacle from Infosys.
Kumar, S. (2015). Does federating help self-help groups? An empirical study. The Microfinance Review, 7(1), 26–40.
Microfinance Gateway. (n.d.). What is microfinance. Retrieved, 22 January 2023, from https://www.microfinancegateway.org/what-is-microfinance
MicroRate. (2014, May). Technical guide 2014/2, Retrieved, 22 January 2023, from http://www.microrate.com/media/downloads/2014/05/MicroRate_- Technical-Guide-20142.pdf
NABARD. (2022). Status of microfinance in India, 2021–22. Retrieved, 22 September 2025, from https://www.nabard.org/auth/writereaddata/tender/2707225843somfi-2021-22-final-english.pdf
Nandi, A., Nandan, S., & Koshy, S. (2018). The Bharat microfinance report, 2017–18. Sa-Dhan. Retrieved, 22 September 2025, from https://www.sa-dhan.net/bharat-microfinance- report/
Nandi, A., Nandan, S., & Koshy, S. (2019). The Bharat microfinance report, 2018–19. Sa-Dhan. Retrieved, 22 September 2025, from https://www.sa-dhan.net/bharat-microfinance- report/
Nandi, A., Nandan, S., & Koshy, S. (2020). The Bharat microfinance report, 2019–20. Sa-Dhan. Retrieved, 22 September 2025, from https://www.sa-dhan.net/bharat-microfinance- report/
Nandi, A., Nandan, S., & Koshy, S. (2022). The Bharat microfinance report, 2021–22. Sa-Dhan. Retrieved, 22 September 2025, from https://www.sa-dhan.net/bharat-microfinance- report/
Nandi, A., Nandan, S., & Koshy, S. (2023). The Bharat microfinance report, 2022–23. Sa-Dhan. Retrieved, 22 September 2025, from https://www.sa-dhan.net/bharat-microfinance- report/
Osterwalder, A., & Pigneur, Y. (2009). Business model generation. Self-published.
Rappa, M. (2010). Business models on the web. Retrieved, 31 December 2022, from http://home.ku.edu.tr/~daksen/mgis410/materials/Business_Models_on_the_Web.pdf
Reserve Bank of India. (2021). BRICS digital financial inclusion report: India.
Retrieved, 22 September 2025, from https://m.rbi.org.in/scripts/OccasionalPublications.aspx?head=BRICS%20Digital%20Financial% 20Inclusion%20Report
Srinivas, H. (2015). Microfinance—Credit lending models. GDRC Research Output E-059. Global Development Research Center. Retrieved, 17 February 2023, from https://www.gdrc.org/icm/model/model-fulldoc.html
Teece, D. J. (2010). Business models, business strategy and innovation. Long Range Planning, 43(2–3), 172–194. http://dx.doi.org/10.1016/j.lrp.2009.07.003
Watson, D. (2005). Business models. Harriman House.
Uddin, M. H., Akter, S., Mollah, S., & Al Mahi, M. (2022). Differences in bank and microfinance business models: An analysis of the loan monitoring systems and funding sources. Journal of International Financial Markets, Institutions and Moneys 80, 101644. https://doi.org/10.1016/j.intfin.2022.101644
