Review of Professional Management

 Search
1 Department of Commerce, Vidyasagar University, West Bengal, India
2 Department of Business Administration, Vidyasagar University, West Bengal, India

Creative Commons Non Commercial CC BY-NC: This article is distributed under the terms of the Creative Commons Attribution-NonCommercial 4.0 License (http://www.creativecommons.org/licenses/by-nc/4.0/) which permits non-Commercial use, reproduction and distribution of the work without further permission provided the original work is attributed.
Financial system plays an important role in an economy. The banking sector in India has been undergoing reforms for a long time with the aim to develop competitiveness, increase inclusiveness, create big-sized banks and improve operational efficiency. The present investigation looks at the efficiency of the public sector banks for the period 2012–2018, using data envelopment analysis under the assumption of constant returns to scale. The two-input, two-output model is used to determine the efficiency levels on the basis of Minimum Distance to Strong Efficient Frontier as proposed by Aparicio et al. (2007). In order to capture the effect of non-performing assets (NPAs), efficiency is computed under the restricted (with NPAs not included) and unrestricted model (with NPAs considered as an undesirable output). The study finds that majority of the banks have been consistently performing quite well compared to their peers and overall industry. The correlation in the ranking of banks under the two models shows high and significant value in all the years.
Banking, DEA, technical efficiency, constant returns to scale
Introduction
The countries across the globe have been going through reforms which aim to make the economy stronger and shock-resilient. In this era of turbulent environment, stagnancy is bound to lead to failure and hence there is a need to change and bring about continuous reforms. The aim of reforms is to bring about a positive development in the economy. With banking being a key sector of an economy, it cannot remain unscathed from the change. Due to the rippling effect of such reform measures, the different sectors get affected of which banking is one of them. The key reason is the systemic importance of the sector that has wide repercussions for the economy. In the words of Stiglitz and Squire (1998), the financial sector is considered to be the brain of an economy. An efficient and sound banking system leads to improvement in the condition of the economy (Kim et al., 2012; Peltonen et al., 2011) by helping to reduce the cost of funds/credit, best allocation of loanable funds to the needy sectors of the society and also transmitting the effect of policies framed by the central bankers (Jonas & King, 2008). Banks in an economy play a vital role in promoting economic growth and development. Thus, the prominence of the banking sector is undoubtedly paramount. With the growing importance of the sector, there is always a discussion among researchers, academicians and policymakers to understand the performance of this sector. Among the parameters that are generally considered, profitability, productivity, efficiency and fragility form the key areas of focus. However, with the changing landscape of the banking sector and increase in industry competition, the issues of efficiency and productivity have been gaining increasing importance. It is of paramount importance to study the impact of reforms on the banking sector as the experience worldwide has been mixed. The way this sector has been undergoing reforms makes it very coherent for researchers to explore into its effect on banking. This study looks deeply into the impact of such reforms on the efficiency level of public sector banks that still hold a share of 60% in the business of the banking industry.
There are research evidences that show that, with the banking sector reforms and entry of private sector banks, the public sector banks have been feeling the competitive pressure. Several measures have brought about a massive change in the functioning of banks (Uppal, 2011) due to which banks have been expanding their network all across the country either in brick-and-mortar form or through non-physical branches. The sector has transformed itself by bringing change with regard to its focus and institutional governance (Laxman et al., 2008). In a recent study by Spierdijk et al. (2017), the effect of regulatory changes on banks of the United States has been studied by looking at the low level of substitutability of important inputs. Following the sub-prime crisis, the banks in order to boost the development of the economy and to escalate the growth of different industries had followed a practice of indiscriminate loan disbursement that led to an accumulation of huge non-performing loans in the books of the banks. This ‘crazy’ banking led to a deteriorating effect on the financial health of the banks, thereby affecting their stability. This attitude for a significant time resulted in a burgeoning effect on poor loans (Hafsal, 2020). The same finding has been pointed by the Financial Survey 2017 with public sector banks. As per the Reserve Bank of India (RBI) reports, the gross non-performing assets (NPAs) as a percentage of total loans stood at 14.6% for the public sector banks compared to 11.2% for private banks. With the sub-prime mortgage crisis affecting the global financial system, there was a severe impact on the banks due to the sudden slump in business across sectors which led to an increase in quantum of NPAs. Consequently, the RBI had to resort to several measures in order to put a brake on the burgeoning bad loans that got accumulated in the books of the banks. Not only did the rise in NPAs result in increased credit risk for the banks but it also impacted the profitability of banks negatively. This investigation finds the effect of NPAs on the efficiency of banks.
Literature Review
The summary of different studies made with regard to efficiency in banking is given below. There are several studies that employed efficiency measurement to assess the performance of banks (Arjomandi et al., 2011, 2008). Some employed data envelopment analysis (DEA) to measure efficiency (Dhanapal, 2012; Gulati, 2011) and many others employed it to study productivity (Daley & Matthews, 2009; Matthews et al., 2007). Wanke et al. (2016) observed DEA to be the key tool for undertaking efficiency studies. The application of DEA as a tool to study the banking industry has been done in various countries such as Iran (Arjomandi et al., 2011), India (Khan & Sinha, 2015; Mukta, 2016; Sinha & Khan, 2015), Jamaica (Daley & Matthews, 2009), European Union (Svitalkova, 2014), Pakistan (Ahmad et al., 2015), Thailand, Taiwan (Chang et al., 2011) and many others.
Although the story of financial sector reforms has been experienced in various countries, the results are varied. The study of Iranian banks showed deteriorating effect on productivity due to regulatory changes (Arjomandi et al., 2011). The Polish-based study by Balcombe et al. (2006) showed divergence in the effect of reforms on productivity. The study on Thai banking during the reform period showed positive impact of change with inefficiency in the range of 3%–10%. The study by Daley and Matthews (2009) on the effect of changes on the productivity of Jamaican Banks found an inconsistent and fluctuating pattern in terms of growth. Dhanapal (2012) in the study of banks in India found the importance of poor-quality loans on the profitability of these institutions. In India, the application of efficiency analysis on public sector banks found an inefficiency to the extent of almost 13%, with the best performing banks being IDBI Bank, Corporation Bank and Indian Bank (Bala & Kumar, 2011). Gupta et al. (2008) found the State Bank group to be the most efficient one. Gulati (2011), in a similar study on private sector banks, not only found inefficiency to the extent of almost 20% but also identified that ICICI Bank, Yes Bank and HDFC Bank to be the dominant banks. Recent study by Mukta (2016) found Indian public sector banks to be less efficient than their private counterparts. The recent study by Hafsal et al. (2020) lamented the role of NPAs plaguing the banking industry. The study by Sharma and Gupta (2010) found the dominance of nationalised banks in respect of scale efficiency and that of private banks in technical efficiency. In a recent cross-sectional study by Rakshit (2019) on commercial banks in India, larger-sized banks were found to be more efficient in respect of profitability. The research by Martinez-Campillo et al. (2020) used network slack DEA to study efficiency of public sector banks and found the close relationship between social performance and operational performance.
To discuss further, it is seen that there are numerous studies that explored the effect of poor-quality loans on banking profitability (Balasubramaniam, 2012; Ganesan & Santhanakrishnan, 2013). Gitto and Mancuso (2012) in the study on Italian financial institutions found that reforms had a varied effect on productivity with only six institutions showing an improvement and remaining fifteen showing decline. Chang et al. (2011) applied the Nerlovian profit indicator to study the performance of Taiwanese banks. The study showed that allocative efficiency played a more important role compared to technical efficiency. Moreover, the older banks outperformed the new generation banks. The findings by Matthews et al. (2007) on the productivity growth of banks in China due to the reforms showed negative growth for the state-owned banks when poor-quality loans were included in the study. The study by Kamau (2011) on Kenyan banks showed an overall reduction in the productivity growth with the passage of time as a result of reforms. In this backdrop, the researchers in this study look at the effect of NPAs on the performance of public sector banks in the Indian context. There is no study to the knowledge of researchers in Indian respect that looked into the change in relative position of public sector banks based on efficiency derived with the inclusion of NPAs in the DEA linear programming model. This gap has been accordingly addressed by the researchers in this contribution.
Objectives and Hypotheses of the Study
The key objectives of this empirical study are as follows:
Accordingly, the hypotheses of the study are as follows:
H0: There is no significant difference in the ranks obtained under the two models.
H1: There is significant difference in the ranks obtained under the two models.
Research Design
The research is adopted to determine the efficiency of Indian public sector banks. For the investigation, sample comprises 20 banks (which covers more than 80% of the business of public sector banks in the country). The remaining banks were not considered as they were merged with some bigger sized banks towards the end of the last decade. The period 2012–2018 is considered, as this phase experienced a sudden escalation of NPAs in the industry and more noticeably in the books of public sector banks. The investigation is based on secondary data collected from the Capitaline database. The research considers the application of DEA, a non-parametric statistical method for efficiency analysis under the assumption of constant returns to scale. This technique has been popularly applied in efficiency studies (Harimaya & Kondo, 2016; Jaouadi, 2014; Novickyte & Drozdz, 2018) because of its ability to consider multiple inputs and outputs. Since the output maximisation method is followed, it implies the extent by which output needs to be escalated, keeping the inputs unchanged that will make the bank efficient.
In this study, the best practice frontier is the Minimum Distance to Strong Efficient Frontier as proposed by Aparicio et al. (2007). For determining efficiency results, the model proposed by Banker et al. (1984) has been applied under the consideration of two inputs (deposits and advances) and two outputs (investments and loanable funds). The present exploration considers cues from the research contribution of Guo and Wu (2013) where the outputs are categorised into two namely desirable and undesirable outputs. Accordingly, the investigators consider two models simultaneously: (a) the restricted/basic model (excluding net NPAs) and (b) the unrestricted/non-traditional model (with net NPAs included as an undesirable output). Thus, this study applies the extended form of the original concept given by Dong and Jie.
Analysis and Findings
The discussion below highlights the position of selected public sector banks in respect of efficiency. The results focus on efficiency score under two separate considerations which are: (a) under the non-consideration of NPAs and (b) under the consideration of NPAs.
Results of the Restricted Model
Table 1 presents the findings of technical efficiency score under the non-consideration of NPA. The results show that out of the total sample, around one-third of the banks attain a relative efficiency score of 1 in all years of the study period. The banks include Canara Bank, Indian Bank, Punjab & Sind Bank, State Bank of India, Syndicate Bank, UCO Bank, United Bank and Vijaya Bank. About 55% of the banks have an efficiency score that falls in the range of 90% to less than 100% efficiency level, which make them inefficient. Only two banks, namely, Bank of India and Indian Overseas Bank (IOB), have efficiency score of 88.5% and 87.1%, respectively. Hence, for these two banks, there is a need to improve their performance by almost 12% in order to reach the efficient frontier. The mean score of efficiency during the period remains in the range of 94.5% and 97.8%. The coefficient of variation score shows low variability around the mean thereby pointing to consistency in performance. However, Dena Bank looks to be an exception with the coefficient of variation of 0.186 which is quite high.
Table 1. Technical Efficiency in Case of Restricted Model
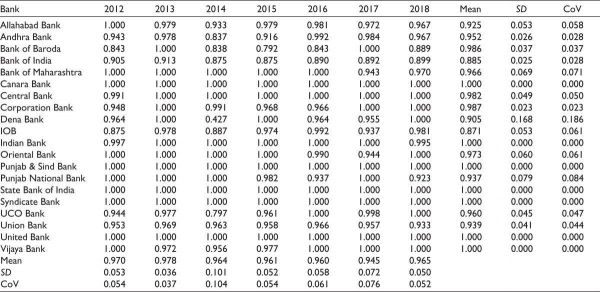
Note: Restricted model implies NPAs are not considered.
Results of the Unrestricted Model
In the second model, net NPAs are additionally considered as an undesirable output for computing the efficiency score. Table 2 shows that the number of banks that remained efficient throughout the study period came down to five from seven because of the effect of poor-quality loans. The standard deviation of the efficiency scores remains at a low level for the majority of the banks, except for Andhra Bank (5.5%), Bank of Baroda (8.2%) and UCO Bank (7.2%). Furthermore, the banks which were found to be ‘efficient’ with a score of 100% included Canara Bank, Punjab & Sind Bank, State Bank of India, Syndicate Bank, UCO Bank, United Bank and Vijaya Bank. Although majority of the banks attained a score of more than 90%, Bank of Baroda had an inefficiency of 11.3%. The overall average efficiency during the period exceeded 90%.
Table 2. Technical Efficiency in Case of Unrestricted Model

Note: Under unrestricted model, NPAs are included as an undesirable output.
Ranking of Banks Based on the Restricted Model
In this section of the study, the investigators determine the relative position of the sample banks with the poor loans excluded from the model. This analysis does not only give us an idea about the ranks but also relative change in ranks during the period.
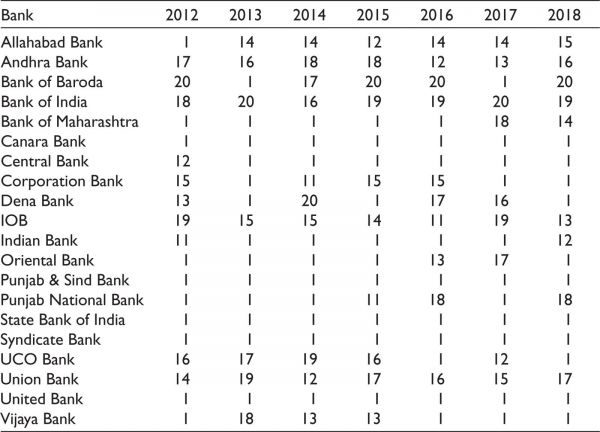
For ranking purpose, the banks that have efficiency score of 1 are allotted a rank of 1 and then the following banks are ranked accordingly. Table 3 shows that Canara Bank, Central Bank, Indian Bank, Punjab & Sind Bank, State Bank of India, Syndicate Bank, United Bank and Vijaya Bank hold the first rank in all the years, thereby pointing to a commendable performance. Although Bank of Baroda, Punjab National Bank and UCO Bank show deterioration in the rank among the sample banks, Bank of Maharashtra shows a substantial decline in its rank during the later years of the study period.
Table 3. Ranking of Banks, Excluding NPAs

Results of the Unrestricted Model
The discussion in this sub-section finds the relative position of the sample public sector banks when poor quality loans are included as a negative output in the DEA linear programming formulation. It is important to know this, as it will give an idea about significant change in the ranks, if any, under the two different methods.
Table 4 shows wide fluctuation in the relative position of different banks during the study period. A glance through the table shows consistency in performance of Canara Bank, Central Bank, Punjab & Sind Bank, State Bank of India, Syndicate Bank and United Bank. The consistency is visible from their ranking of 1 for the majority of the years. The banks that show little improvement in respect of their relative position include Corporation Bank, UCO Bank and Vijaya Bank. However, there were certain banks that showed a drastic fall in their performance, as evident from the rank over the period. The names include Allahabad Bank, Andhra Bank, Bank of India, IOB, Indian Bank, Punjab National Bank and Union Bank. The financial institutions that show an improvement in respect of their ranking in the industry is due to the low NPAs because of certain measures as an outcome of stricter regulations and operational restrictions imposed on operations by the RBI under the prompt corrective mechanism because of the rise in the NPA levels in the middle years of the study.
Table 4. Ranking of Banks with NPAs
Relationship in the Ranks Based on the Two Models
This analysis is important as it gives the result about the degree of similarity in ranks obtained under the two methods. A higher rank correlation score implies high similarity, which means that the relative position of the banks did not show wide difference under the two methods. The rank correlation value in the different years is presented in Table 5.
Table 5. Spearman’s Rank Correlation

Note: *** indicates significant at 1% level.
The value of Spearman’s rank correlation coefficient shows that the association is not only high in all the years but also significant at 1% level with the highest and lowest values being 0.919 and 0.659, respectively. Thus, there is a close parity in the ranks following the two methods. Hence, there has not been much change in the ranking of the banks under the two methods which points that the impact of NPAs has been felt across the banking space. The ones that held the first rank were able to hold on to similar ranks because of effective NPA management. This was evident from the different restrictive practices that the banks had started following the surge in NPA levels which included ‘safe’ banking and not ‘crazy’ banking that was responsible for the rise in the NPA levels to unsafe levels during the last decade.
Conclusions
The banking sector is among the key sectors of an economy. The strength of an economy is very much dependent upon the resilience of the financial system. There is a positive connection between banking sector stability and economic growth. Thus, with the sector playing such a vital role, this arena has been in the limelight of reforms process. In fact, it is seen that with economic sector reforms taking place, there have been several changes that the banking sector has experienced. With the Indian economy growing at close to double digits in the first decade of the present century, the credit–deposit ratio was at a commendable level, as the industries experienced a rising phase which boosted the demand for industrial loans. However, the sub-prime mortgage crisis in 2008 changed the overall scenario across the globe, including India. Though the environment became subdued, banks continued with their practice of ‘crazy’ banking that got reflected with the rise in NPA levels in the financial books of public sector banks. There was an escalation in the level of NPAs during the second decade and, accordingly, the RBI, the banking regulator, had to resort to several measures in order to control the rise in poor loans in the books of the banks.
In this backdrop, the researchers in this study look at the performance of banks from the viewpoint of efficiency. In contrast to the previous contributions in banking, the researchers consider two models simultaneously—restricted and unrestricted—to understand how the efficiency and relative position of banks has changed due to the impact of NPAs. The main intention is to see whether there is a significant impact of poor-quality loans on the position of banks. The study finds that the sector shows good efficiency level in all years of the study period, and the level of variation is on the lower side which shows consistency in the performance. One possible reason is the application of the approach proposed by Aparicio et al. (2007). Our findings support the findings of Dhar (2012), which found the public sector banks to be superior. However, it contradicts the results of Jayaraman and Sharma (2018) who found public sector banks to be poor performing in comparison to private and foreign banks. On the contrary, foreign banks were found to be better performing than the public sector banks, as noted in Mazumdar (2019). The ranking of different banks shows that the most consistently performing banks are the large-sized banks that include Canara Bank, Central Bank, Indian Bank, Punjab & Sind Bank, State Bank of India, Syndicate Bank, United Bank and Vijaya Bank. However, the position of Bank of Baroda, Punjab National Bank and UCO Bank shows deterioration on the basis of evaluation under the non-consideration of NPAs. The mean efficiency score lies in the range of 94.5% and 97.8%. On the other hand, while considering poor loans as an undesirable output, it is observed that the standard deviation of the score of the banks remained at a low level for the majority of the banks, except Andhra Bank, Bank of Baroda and UCO Bank. The banks that are found to be ‘efficient’ include Canara Bank, Punjab & Sind Bank, State Bank of India, Syndicate Bank, United Bank and Vijaya Bank. Although majority of the banks attained a score of more than 90%, Bank of Baroda had the maximum inefficiency score of more than 10%. The average efficiency result for all years of the study period exceeded 90%. The last part of the analysis looked at the association between the ranks obtained by the banks under the two methods, which showed that there was a significantly high positive correlation. This can be interpreted as there being not much change in the relative position of the banks. The result shows that the better placed banks had been able to manage the NPAs better in comparison to others because of which the majority of the leading banks could maintain their prominent position.
Managerial Implications
The banking industry plays a vital role in any economy. The stability of the financial system in India has repercussions on the stability of the overall financial system in this region of the world. The findings of this study are vital and have implication for managers. It shows that the consideration of poor-quality loans has least influence on the relative efficiency of public sector banks. However, it is of no doubt that NPAs are a burden for the banking industry and have severe impact on the profitability and financial strength of the banks and, thereby, the overall banking system. Thus, it can be opined that in order to understand the real effect of poor loans on banks’ performance, it is better to consider other operational measures to capture the impact of NPAs on the financial stability of the banks and their operational riskiness. Moreover, for tightening the ropes of control by the regulator, it is necessary to take measures on the basis of gross NPAs instead of net NPAs. The adjustment of provisions to arrive at net NPAs negates the true non-performance to some extent. Thus, the findings can definitely guide managers and policymakers in regulating the industry and take commensurate strategies based on the performance with regard to quality of banking assets.
Declaration of Conflicting Interests
The authors declared no potential conflicts of interest with respect to the research, authorship and/or publication of this article.
Funding
The authors received no financial support for the research, authorship and/or publication of this article.
Ahmad, H. K., Mujaddad, H. G., & Nadeem, M. (2015). An analysis of banks performance in Pakistan using two-step double bootstrap DEA approach. Pakistan Economic and Social Review, 331?350.
Aparicio, J., Ruiz, J., & Sirvent, I. (2007). Closest targets and minimum distance to the Pareto-efficient frontier in DEA. Journal of Productivity Analysis, 28(3), 209?218.
Arjomandi, A., Valadkhani, A., & Harvie, C. (2011). Analysing productivity changes using the bootstrapped Malmquist approach: The case of the Iranian banking industry. Australasian Accounting Business and Finance Journal, 5(3), 35?56.
Bala, N., & Kumar, S. (2011). How efficient are public sector banks in India An empirical investigation. Journal of Banking and Financial Services & Insurance Research, 1(3), 39?62.
Balasubramaniam, C. S. (2012). Non-performing assets and profitability of commercial banks in India: Assessment and emerging issues. National Monthly Refereed Journal of Research in Commerce & Management, 1(7), 41?52.
Balcombe, K., Davidova, S., & Latruffe, L. (2006, August 12?18). The use of bootstrapped Malmquist indices to reassess productivity change findings: An application to a sample of Polish farms [Paper presentation]. International Association of Agricultural Economists Conference, Gold Coast, Australia.
Banker, R. D., Charnes, A., & Cooper, W. W. (1984). Some models for estimating technical and scale inefficiencies in data envelopment analysis. Management Science, 30(9), 1078?1092.
Chang, K. C., Lin, C. L., Cao, Y., & Lu, C. F. (2011). Evaluating branch efficiency of a Taiwanese bank using data envelopment analysis with an undesirable factor. African Journal of Business Management, 5(8), 3220?3228. https://doi.org/10.5897/AJBM10.962
Daley, J., & Matthews K. (2009). Measuring post-crisis productivity for Jamaican banks [Cardiff economics working papers no. E2009/29].
Dhanapal, C. (2012, September 6?7). Measuring operational efficiency of public sector banks in India [Paper presentation]. International Conference on Business and Management, 700?713.
Dhar, S. (2012). Banking reforms for financial inclusion: Performance of selected Indian banks. Amity Management Review, 2(2), 34?39.
Dong, Y., Hamilton, R., & Tippett, M. (2014). Cost efficiency of the Chinese banking sector: a comparison of stochastic frontier analysis and data envelopment analysis. Economic Modelling, 36, 298?308.
Ganesan, D., & Santhanakrishnan, R. (2013) Non-performing assets: A study of State Bank of India. Asia Pacific Journal of Research, 1(10), 1552?1555.
Gitto, S., & Mancuso, P. (2012). Two faces of airport business: A non-parametric analysis of the Italian airport industry. Journal of Air Transport Management, 20(May), 39?42. https://doi.org/10.1016/j.jairtraman.2011.11.003
Gulati, R. (2011). Evaluation of technical, pure technical and scale efficiencies of Indian banks: An analysis from cross-sectional perspective [Paper presentation]. 13th Annual Conference on Money and Finance in the Indian Economy, IGIDR, Mumbai.
Guo, D., & Wu, J. (2013). A complete ranking of DMUs with undesirable outputs using restrictions in DEA models. Mathematical and Computer Modelling, 58(5?6), 1102?1109.
Gupta, O. K., Doshit, Y., & Chinubhai, A. (2008). Dynamics of productive efficiency of Indian banks. International Journal of Operations Research, 5(2), 78?90.
Hafsal, K., Suvvari, A., & Durai, S. R. S. (2020). Efficiency of Indian banks with non-performing assets: Evidence from two-stage network DEA. Future Business Journal, 6(1), 1?9.
Harimaya, K., & Kondo, K. (2016). Effects of branch expansion on bank efficiency: Evidence from Japanese regional banks. Managerial Finance, 42(2), 82?94.
Jaouadi, S. (2014). Exploring the effectiveness and efficiency of banks in Switzerland. International Journal of Academic Research in Business and Social Sciences, 4(4), 313?325.
Jayaraman, T. K., & Sharma, A. (2018). Measuring banking efficiency in India: An empirical study of commercial banks. Indian Journal of Accounting, 50(1), 28?36.
Jonas, M. R., & King, S. K. (2008). Bank efficiency and the effectiveness of monetary policy. Contemporary Economic Policy, 26(4), 579?589.
Kamau, A. W. (2011). Intermediation efficiency and productivity of the banking sector in Kenya. Interdisciplinary Journal of Research in Business, 1(9), 12?26.
Khan, T. L., & Sinha, A. (2015). Are the private sector banks in India more efficient than the Public sector banks GITAM Journal of Management, 13(1), 166?181.
Kim, D.-H., Lin, S., & Suen, Y. (2012). Dynamic effects of financial openness on economic growth and macroeconomic uncertainty. Emerging Markets Trade and Finance, 48(1), 48?54.
Laxman, R., Deene, S., & Badiger, S. (2008). Changing dimensions of banking sector in India. In R. K. Uppal (Ed.), Paradigm shift in Indian banking (pp. 70?80). Mahamaya Publishing House.
Mazumdar, M. D. (2019). An empirical study on measurement of efficiency of selected banks in India. Indian Journal of Economics and Development, 7(3), 1?5.
Martinez-Campillo, A., Wijesiri, M., & Wanke, P. (2020). Evaluating the double bottom-line of social banking in an emerging country: How efficient are public banks in supporting priority and nonpriority sectors in India Journal of Business Ethics, 162(2), 399?420.
Matthews, K., Guo, J., & Zhang, N. (2007). Non-performing loans and productivity in Chinese banks: 1997?2006 [Cardiff economics working papers no. E2007/30].
Mukta, M. (2016). Efficiency of commercial banks in India: A DEA approach. Pertanika Journal of Social Sciences and Humanities, 24(1), 151?170.
Novickyte, L., & Drozdz, J. (2018). Measuring the efficiency in the Lithuanian banking sector: The DEA application. International Journal of Financial Studies, 6(37), 1?15.
Peltonen, T. A., Sousa, R., & Vansteen, I. S. (2011). Fundamentals, financial factors, and the dynamics of investment in emerging markets. Emerging Markets Finance and Trade, 47(Sup 2), 88?105.
Rakshit, B. (2019). Evaluating profitability and marketability efficiency: A case of Indian commercial banks. Global Business Review, 22(4), 977?995. https://doi.org/10.1177/0972150918822569.
Sharma, S., & Gupta, S. (2010). Malmquist productivity and efficiency analysis for banking industry in India. International Journal of Business Excellence, 3(1), 65?76.
Sinha, A., & Khan, T. L. (2015). Impact of global financial crisis on the efficiency of Indian banking sector: An assessment. IIMS Journal of Management Science, 5(1), 67?80.
Spierdijk, L, Shaffer, S., & Considine, T. (2017). How do banks adjust to changing input prices A dynamic analysis of US commercial banks before and after the crisis. Journal of Banking and Finance, 85, 1?14.
Stigitz, J. E., & Squire, L. (1998). International development: Is it possible Frontiers of Knowledge, 110, 138?151.
Svitalkova, Z. (2014). Comparison and evaluation of bank efficiency in selected countries in EU. Procedia Economics and Finance, 12, 644?653.
Uppal, R. K. (2011). Banking sector reforms: Policy implications and fresh outlook. Information Management and Business Review, 2(2), 55?64.
Wanke, P., Azad, M. A. K., Barros, C. P., & Hassan, M. K. (2016). Predicting efficiency in Islamic banks: An integrated multicriteria decision making (MCDM) approach. Journal of International Financial Markets, Institutions and Money, 45, 126?141.
?
