Review of Professional Management

 Search
Pooja Singh Negi1  and Mansi Sharma1
1Department of Management Studies, Management Education and Research Institute, New Delhi, Delhi, India

Creative Commons Non Commercial CC BY-NC: This article is distributed under the terms of the Creative Commons Attribution-NonCommercial 4.0 License (http://www.creativecommons.org/licenses/by-nc/4.0/) which permits non-Commercial use, reproduction and distribution of the work without further permission provided the original work is attributed.
Financial institutions play a pivotal role in India’s economic development by offering loans, advances and asset management services. This study conducts a comprehensive comparative analysis of the financial performance of the Delhi Financial Corporation (DFC) and the Kerala Financial Corporation (KFC) over a five-year period, emphasising liquidity, profitability, solvency and asset utilisation. Using secondary data extracted from annual reports and official financial disclosures, the study employs a series of financial ratios—including current ratio, quick ratio, return on assets, return on equity, debt-to-equity and asset turnover—to evaluate the fiscal health of both institutions. The findings reveal a stark divergence in financial trajectories: DFC exhibits declining liquidity, substantial accumulated losses, high leverage and inefficient asset utilisation, signalling financial distress and long-term sustainability risks. In contrast, KFC demonstrates consistent profitability, stronger liquidity management, healthier solvency ratios and superior operational efficiency, indicating financial resilience. The comparative insights underscore the need for strategic restructuring, improved credit risk management and operational optimisation in DFC, while positioning KFC as a benchmark for stability among state-level financial corporations. This study contributes to institutional financial analysis literature by highlighting how structural, policy and operational differences shape financial outcomes across public-sector financial institutions in India.
Financial performance (inter-firm) comparison, solvency, efficiency, liquidity and profitability
Introduction
Financial institutions are considered fundamental drivers of economic development, serving as conduits for capital formation, industrial expansion and entrepreneurial growth. The financial institutions assist in the proper allocation of resources and ensure the continuing circulation of money. In India, state-level financial institutions (SLFIs) such as state financial corporations (SFCs) were established to fulfil the credit gap for small and medium enterprises (SMEs), a segment often ignored by commercial banks (Mohan, 2021). Undoubtedly, these institutions enhanced balanced regional development through the provision of long-term loans, working capital, refinancing and advisory services. Their performance has a direct impact on regional industrialisation, job creation and overall socio-economic progress (Bhoi & Sahoo, 2020). This process subsequently ensures earning on the investments and savings.
Among all these SLFIs, the Delhi Financial Corporation (DFC) and the Kerala Financial Corporation (KFC) hold a strategic role as they support MSMEs, service sectors and local industries in two distinctly different economic environments. DFC operates in a metropolitan industrial cluster characterised by service-dominant economic activity, while KFC functions within a more diversified economy integrating tourism, manufacturing and agro-based industries. Examining these institutions provides important comparative insights into how regional variations influence financial performance and institutional resilience. Other financial institutions include Export Credit Guarantee Corporation of India (ECGC) Ltd. and Deposit Insurance and Credit Guarantee Corporation.
Prior studies evaluating Indian development finance institutions highlight ongoing challenges such as rising non-performing assets, liquidity constraints and pressures on profitability (Chattopadhyay, 2020; Rao & Anwar, 2020). Research also emphasises that financial sustainability and developmental performance must be analysed together, as DFIs operate with mixed objectives—balancing commercial viability with developmental mandates (Pandey, 2019). Comparative financial analyses of public-sector institutions demonstrate that inter-firm evaluations provide richer insights than isolated case studies, as they reveal structural differences arising from governance practices, economic contexts, and credit management strategies (Kumar & Joseph, 2021; Mishra & Singh, 2020). The SFCs provide loans mainly for the acquisition of fixed assets like land, buildings, plants and machinery.
The study is all about the main issues with SFCs, such as making decisions all from one place, not having a corporate culture, high transaction costs, a rise in non-performing assets (NPAs) and high NPAs that happen because of a lot of assets being moved from the standard assets category to the NPAs category, which cancels out the effect of extra provisioning that made cash flow tight. This, in turn, resulted in the restructuring of liabilities. However, focusing specifically on SFCs, particularly DFC and KFC, is limited. Existing studies tend to examine broad national trends or single-institution performance without conducting systematic inter-state comparison or multi-year trend analysis. This creates a research gap that the present study aims to address.
DFC and KFC were selected because they are among the most prominent and functionally active SFCs in India, with extensive loan portfolios and consistent annual reporting, which ensures the availability of reliable secondary data. Their geographical and economic contrasts also make them ideal candidates for inter-firm evaluation, enabling a deeper understanding of how institutional performance varies across different regional economic contexts. Analysing these corporations helps identify operational strengths, structural constraints and areas requiring policy intervention.
A five-year timeframe is methodologically appropriate because it captures medium-term trends, minimises short-term fluctuations and reflects the impacts of economic cycles, policy changes, and managerial strategies (Sharma & Bansal, 2022). Financial indicators such as profitability, solvency, liquidity, and asset quality show meaningful shifts only over extended periods, and a five-year span is widely used in financial performance research for ensuring reliability and consistency (Gitman & Zutter, 2018). This duration also aligns with the reporting practices of public-sector financial institutions, making comparisons robust and credible. This research will follow the objectives:
Given the developmental importance of SFCs and the limited availability of comparative research on DFC and KFC, this study contributes to both academic literature and practical policy discourse. By analysing five-year financial data of two regionally distinct institutions, the study provides a brief understanding of their financial health, operational patterns and strategic opportunities for improvement.
Literature Review
A literature review is typically undertaken to gauge the current state of specific research. Research papers, articles, books, journals, magazines and other related resources were reviewed to access relevant literature. Financial institutions play a crucial role in fostering industrial and entrepreneurial growth, especially in emerging economies like India. SLFIs such as DFC and KFC are established as development finance institutions (DFIs) to support MSMEs, small businesses and regional industrialisation. The literature on DFIs, financial performance analysis and regional development finance highlights several conceptual and empirical insights relevant to this study.
Development Financial Institutions and Their Economic Role
Development finance institutions are designed to fill credit gaps not adequately served by commercial banks, especially for small and medium enterprises. According to Bhoi and Sahoo (2020), DFIs contribute significantly to regional socio-economic advancement by providing long-term capital and promoting industrial diversification. Similarly, Mohan (2021) emphasises that state-level DFIs in India have historically acted as catalysts in industrial expansion by supporting infrastructural and entrepreneurial activities. These institutions not only extend credit but also provide advisory and developmental services, making them essential agents of balanced regional development. Gopakumar (2005) investigated the impact of institutional finance on small-scale industries in Kerala, analysed KFC’s role in the MSME sector and identified challenges in its recovery and advocacy to enhance KFC’s current status.
Financial Performance Evaluation in DFIs
Financial evaluation of DFIs often relies on profitability, solvency, liquidity and asset quality metrics. Pandey (2019) notes that performance assessment must incorporate both financial sustainability and developmental impact because DFIs operate with hybrid objectives. Studies on Indian DFIs highlight recurring challenges such as high NPAs, declining profit margins and capital adequacy concerns (Rao & Anwar, 2020). These issues underscore the need for continuous evaluation to ensure institutional health and policy alignment. However, Rawat (2017) proposes that the government should take decisive action to eliminate the SFCs.
Comparative Financial Analysis
Comparative financial analyses enable a deeper understanding of how similar institutions respond differently to external conditions. Mishra and Singh (2020) argue that inter-firm comparison reveals structural strengths and weaknesses emerging from governance quality, lending strategies and regional economic characteristics. For SLFIs, inter-state comparisons help determine how local economic climates shape financial outcomes. Comparative studies on state industrial development corporations and state finance corporations (SFCs) show substantial heterogeneity in profitability and asset management, influenced by political, administrative and market conditions (Kumar & Joseph, 2021). This literature supports the need for evaluating DFC and KFC together to understand region-specific performance dynamics.
Financial Ratio Analysis in Public Financial Institutions
Ratio analysis is widely accepted for assessing financial efficiency and stability. According to Gitman and Zutter (2018), profitability ratios indicate managerial effectiveness, while liquidity and solvency ratios reflect financial resilience. In public-sector institutions, ratio fluctuations often mirror economic cycles, government support and loan recovery conditions. Studies by Sharma and Bansal (2022) on Indian financial corporations show that consistent analysis over five-year periods provides meaningful insights into operational sustainability. The literature emphasises that longitudinal data (minimum five years) is essential for capturing trends and minimising distortions caused by short-term volatility. Furthermore, it has been observed that the proper capital ratios and loan portfolios account for bank performance.
Challenges Faced by SFCs
SFCs in India face several structural and operational challenges. High NPAs remain a persistent issue due to weak recovery mechanisms and sectoral downturns (Chattopadhyay, 2020). Policy shifts, competition from commercial banks and limited capital infusion have further affected their operational capacity. According to Narasimham (2021), DFIs must strengthen governance systems, adopt technology-driven credit appraisal and diversify revenue sources to remain sustainable. Such challenges underscore the importance of reviewing institutional performance over time to identify improvement pathways.
While significant research exists on Indian DFIs and SFCs broadly, specific comparative analyses of DFC and KFC are limited. Most studies focus either on national-level policy reforms or on individual institutions without a systematic five-year inter-firm evaluation. The limited availability of region-specific comparative studies presents a research gap, which this study aims to address through comprehensive ratio-based and trend-based analysis of two prominent SLFIs.
Research Methodology
DFC and KFC
DFC and KFC were selected for this study due to their longstanding contributions as SLFIs dedicated to promoting industrial, commercial and entrepreneurial development. These institutions play an essential developmental role by supporting MSMEs, start-ups, small traders and service sectors—segments that significantly influence regional economic growth. DFC and KFC operate under similar statutory frameworks but function within markedly different socio-economic environments, making them ideal for inter-firm comparative analysis.
However, studying these two institutions provides a unique opportunity to understand how regional policies, governance structures, demographic profiles and local economic conditions impact financial performance. Additionally, both corporations have publicly accessible, reliable financial records, enabling transparent and verifiable analysis. Their contrasting geographic contexts—DFC functioning in a metropolitan industrial cluster and KFC operating within a more diversified, semi-urban economic setting—offer meaningful insights into how location-specific dynamics influence financial sustainability. Thus, the selection of DFC and KFC is purposefully designed to yield comprehensive, comparative and policy-relevant conclusions.
Selecting a Five-year Period
For this study, a five-year period is chosen because it provides an optimal timeframe to identify financial trends, detect performance patterns and evaluate long-term stability without being distorted by short-term fluctuations. Considering the financial indicators such as profitability, liquidity, solvency and asset quality exhibit meaningful changes only over an extended period. The reason being, a one- or two-year study would not adequately capture cyclical economic effects, policy impacts or internal organisational shifts.
Moreover, most financial institutions undergo strategic reconstructions, loan restructuring cycles and asset reclassification within a five-year horizon; therefore, considering this span allows for a more accurate assessment of managerial effectiveness and institutional resilience. No doubt that, five-year dataset ensures sufficient variability for comparative analysis while maintaining manageable data consistency and comparability. It also aligns with standard academic and industry practices in financial performance evaluation, making the findings more credible, generalisable and relevant for stakeholders.
Research Design
This study adopts a quantitative, descriptive and analytical research design based entirely on secondary data. Furthermore, financial performance analysis is conducted through established accounting ratios and trend evaluation tools, consistent with standard practices in financial statement analysis (Gitman & Zutter, 2018). The objective is to compare the financial health of the DFC and KFC over a five-year period using systematic ratio analysis and brief graphical interpretation.
Source of Data
The study relies exclusively on secondary data gathered from authentic and verifiable institutional-based sources:
Secondary data are widely used in financial research because these are cost-effective, reliable and drawn from audited records, ensuring accuracy and credibility (Johnston, 2017).
Data Processing and Classification
The collected data were edited, verified, categorised and tabulated before analysis. The data were then organised according to major financial indicators of DFC and KFC. Data cleaning steps included:
Such systematic preprocessing enhances data quality and supports rigorous financial analysis (Kothari, 2004).
Tools of Analysis
Ratio analysis is the primary analytical tool used in the study, as it is universally accepted for evaluating the financial performance of institutions over time (Pandey, 2019). The following ratios were computed: liquidity ratios (current ratio and quick ratio), profitability ratios (return on assets (ROA), return on equity (ROE), net profit ratio, return on capital employed (ROCE), solvency ratio, debt-to-asset ratio and efficiency ratios (total asset turnover ratio and fixed asset turnover ratio) (Table A1). These ratios help evaluate operational strength, financial stability, profitability efficiency and long-term solvency—key dimensions for comparing two SFCs (Rao & Anwar, 2020).
Trend Analysis Using Line Graphs
To visualise the performance patterns across five years, line graphs were used. Line graphs are particularly effective for:
Each ratio was plotted across five financial years to compare DFC and KFC visually. Line graphs also allow comparison of slope patterns, representing the rate of improvement or decline.
Selected Analytical Methods
Ratio analysis combined with trend graphs is a widely recommended approach for longitudinal financial performance evaluation (White et al., 2003). This mixed analytical method:
Therefore, the combined use of ratios and graphical tools provides a comprehensive and insightful financial assessment.
Scope and Period of Study
The study covers five financial years, which is methodologically appropriate because multiple-year data help identify sustained patterns, minimise short-term distortions and reveal meaningful financial movements (Sharma & Bansal, 2022).
Methodological Framework Summary
This structured methodology ensures the analytical rigour, objectivity and reliability in evaluating the financial performance of DFC and KFC.
Results
The comparative financial analysis of DFC and KFC over three years reveals significant divergence in liquidity, solvency, profitability and operational efficiency. The findings highlight a pattern in which KFC consistently demonstrates financial strength, whereas DFC shows growing signs of financial strain and operational underperformance.
The analysis of liquidity ratios, illustrated in Figure A1 and Figure A2 in the Appendix, reveals the substantial differences between DFC and KFC in their ability to meet short-term obligations. As shown in Figure A1, the current ratio for DFC has steadily declined over the three-year period—from 1.33 in 2020–2021 to 1.04 in 2022–2023—indicating weakening liquidity caused by rising current liabilities and shrinking current assets. In contrast, KFC demonstrates a stronger and more stable liquidity trend, with its current ratio fluctuating from 1.51 to 1.18 and rising again to 1.48 in 2022–2023, reflecting improved ability to cover short-term debts. The quick ratio trends in Figure A2 show that although DFC holds more cash and near-cash assets (quick ratio = 1.00 in 2022–2023), KFC continues to maintain operational liquidity even with a lower quick ratio (0.04), suggesting more efficient short-term asset management. These liquidity figures collectively indicate that DFC is experiencing annual deterioration in liquidity, whereas KFC retains stronger short-term financial health.
Profitability measures, presented in Figure A6, Figure A7, Figure A8, Figure A9, further highlight the widening financial gap between the two corporations. The ROCE in Figure A6 shows that KFC consistently performs better, maintaining 0.07 in 2022–2023, whereas DFC’s ROCE sharply declines to 0.01, indicating minimal earnings from capital employed. Similarly, the ROA displayed in Figure A7 reveals that DFC’s asset base generates negative returns (–0.15), while KFC maintains a positive return (0.01). Figure A8 shows an alarming trend in ROE for DFC: its ROE drops to –0.64, reflecting substantial losses incurred by shareholders, whereas KFC’s ROE improves moderately to 0.12. The net profit ratio, shown in Figure A9, provides the most striking contrast—DFC records a massive net loss of –258.71%, indicating that expenses far exceed revenue, while KFC records a healthy and improving net profit of 7%. These profitability findings make it evident that KFC operates in a financially sustainable manner, while DFC is unable to convert its operations into profit and faces ongoing financial distress.
The solvency indicators in Figure A3, Figure A4, Figure A5 shed light on the long-term financial risk associated with each institution. Figure A3 shows that DFC’s debt-to-equity ratio has worsened dramatically, rising from 6.29 in 2020–2021 to 8.62 in 2022–2023, indicating high financial leverage and excessive dependence on borrowed funds. KFC, although leveraged, maintains a much healthier debt-to-equity level of 3.35 in 2023. The debt-to-asset ratio in Figure A4 indicates that both corporations finance a substantial portion of their assets through debt (0.76 for DFC and 0.83 for KFC); however, KFC’s stronger profitability allows it to manage this debt more effectively. The interest coverage ratio in Figure A5 shows that DFC’s ability to pay interest has improved slightly to 2.01, but this improvement is overshadowed by its overall poor profitability. KFC’s interest coverage ratio has declined to 0.79, indicating a rising interest burden; however, given its positive earnings, KFC remains less vulnerable than DFC. Collectively, the solvency figures indicate that DFC is in a high-risk zone with long-term financial instability, while KFC maintains manageable leverage supported by operational profits.
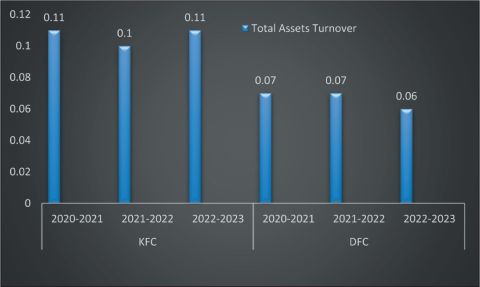
The efficiency ratios shown in Figure A10 and Figure A11 provide insight into how effectively each corporation utilises its assets to generate revenue. Figure A10 shows a dramatic contrast in fixed asset turnover: KFC’s ratio climbs to 93.67 in 2022–2023, demonstrating exceptionally efficient use of fixed assets, while DFC remains at a low 4.07, indicating underutilisation of physical resources. This pattern continues in Figure A11, where the total asset turnover ratio for DFC declines to 0.06, reflecting poor revenue generation from its overall asset base, whereas KFC’s total asset turnover increases to 0.11, showing stronger productivity. These findings clearly indicate that KFC is far more efficient in utilising both fixed and total assets, whereas DFC struggles to generate adequate revenue from its asset base despite rising liabilities.
The financial analysis of DFC and KFC reveals a clear divergence in performance across liquidity, profitability, solvency and efficiency indicators over the three-year period. As shown in Figure A1, KFC consistently maintains a stronger liquidity position than DFC, with its current ratio rising to 1.48 in 2023 while DFC declines to 1.04, and Figure A2 further shows that although DFC holds more liquid assets, KFC manages its current liabilities more effectively. The profitability ratios from Figure A6, Figure A7, Figure A8, Figure A9 highlight substantial losses for DFC—its ROA (–0.15), ROCE (0.01), ROE (–0.64) and net profit ratio (–258.71%) indicate deep financial distress—while KFC’s corresponding ratios remain positive (ROA 0.01; ROCE 0.07; ROE 0.12; net profit 7%), demonstrating stronger financial health. Considering solvency indicators in Figure A3, Figure A4, Figure A5 reveals that DFC carries significantly higher financial risk, with a debt-to-equity ratio of 8.62 and a debt-to-assets ratio of 0.76, reflecting heavy leverage and declining net worth, whereas KFC’s ratios (3.35 and 0.83) indicate a more balanced capital structure despite a lower interest coverage ratio of 0.79 during 2023. The efficiency ratios presented in Figure A10 and Figure A11 further reinforce the performance gap: KFC’s fixed asset turnover (93.67) and total asset turnover (0.11) far outperform DFC’s 4.07 and 0.06, evidencing KFC’s superior ability to convert assets into revenue. Taken together, Figure A1, Figure A2 , Figure A3, Figure A4, Figure A5, Figure A6, Figure A7, Figure A8, Figure A9, Figure A10, Figure A11 depict a consistent pattern in which DFC struggles with liquidity shortages, mounting losses, high debt dependence and inefficient asset utilisation, while KFC demonstrates stable liquidity, positive profitability, manageable leverage and strong operational efficiency.
Overall, the comprehensive examination of Figure A1, Figure A2 , Figure A3, Figure A4, Figure A5, Figure A6, Figure A7, Figure A8, Figure A9, Figure A10, Figure A11 reveals a consistent and widening performance gap between DFC and KFC. DFC’s declining liquidity, severe losses, rising financial leverage, and inefficient use of assets indicate that the corporation is operating under significant financial stress and faces a risk of long-term insolvency if corrective measures are not taken. In contrast, KFC displays superior financial health, stable liquidity, consistent profitability and efficient asset utilisation, positioning it as a stronger, more sustainable institution. The findings emphasise that DFC requires immediate strategic intervention, while KFC’s financial strategies can serve as a benchmark for operational improvement.
Discussion
The comparative analysis of DFC and KFC over the five-year period reveals significant differences in their financial performance, liquidity position, profitability, solvency and asset utilisation. Findings across all ratios consistently demonstrate that KFC is financially stronger and more operationally efficient, while DFC exhibits persistent financial distress, weak liquidity and low profitability.
Liquidity and Short-term Stability
As indicated by the current ratio (Figure A1), KFC maintains a stronger liquidity position, signifying its superior ability to settle short-term liabilities. In contrast, DFC shows a downward trend in current assets coupled with rising current liabilities, reflecting strained liquidity and weakening short-term solvency. These findings are consistent with prior studies suggesting that liquidity stress undermines financial institutions’ operational flexibility and increases vulnerability to external shocks (Pandey, 2019; White et al., 2003).
The quick ratio findings ( Figure A2 ) show that DFC holds more cash and cash equivalents relative to KFC, yet this does not translate into stronger overall liquidity or profitability. KFC’s declining quick ratio reflects higher investment outflows and greater reliance on operating cash flows, which may support long-term growth. Strong operational cash flow is often viewed as a positive indicator of institutional resilience (Gitman & Zutter, 2018).
Solvency and Capital Structure
The debt-to-equity ratio trend (Figure A3) clearly indicates that DFC is heavily leveraged, with rising dependence on borrowed capital. High leverage increases financial risk, reduces creditworthiness and exposes the corporation to solvency challenges. Literature on public financial institutions associates excessive debt and rising NPAs with long-term insolvency risk and erosion of stakeholder confidence (Chattopadhyay, 2020; Rao & Anwar, 2020). Conversely, KFC’s debt-to-asset ratio (Figure A4) shows a healthier capital structure with assets consistently exceeding liabilities. This indicates more prudent debt management and a stable solvency profile. A favourable capital structure enables institutions to sustain operations and pursue growth strategies without excessive financial strain (Kumar & Joseph, 2021).
Interest Servicing Ability
The interest coverage ratio (Figure A5) shows declining performance for KFC, indicating increased interest burden and reduced ability to meet debt obligations through earnings. DFC, despite overall weaker financial performance, shows a comparatively higher interest coverage ratio, although not strong enough to offset broader solvency issues. Declining interest coverage is widely recognised as an early warning sign of financial distress (Sharma & Bansal, 2022).
Profitability and Return Measures
Figure A6, Figure A7, Figure A8, Figure A9 highlight KFC’s consistently superior profitability across multiple measures:
Research on public-sector financial institutions consistently emphasises the importance of profitability as a determinant of long-term survival, especially in competitive lending environments (Mishra & Singh, 2020).
Asset Utilisation Efficiency
Asset turnover ratios (Figure A10 and Figure A11) demonstrate that DFC underutilises both fixed assets and total assets, resulting in lower revenue generation. KFC, on the other hand, displays strong asset utilisation efficiency, suggesting superior management practices and operational productivity. According to established financial theory, higher asset turnover implies effective deployment of resources and greater operational success (Gitman & Zutter, 2018).
Taken together, the findings paint a consistent picture:
These insights align with existing literature, which shows that performance gaps among SFCs stem from governance quality, NPA management effectiveness and regional economic support structures (Mohan, 2021; Rao & Anwar, 2020).
Conclusion
The financial assessment of the DFC over the past five years reveals clear signs of financial stress, declining stability and weakening operational strength. Persistent liabilities, rising debt obligations and an alarming increase in NPAs have severely undermined the corporation’s profitability and its ability to manage financial risks effectively. The declining net worth further indicates that the corporation has been unable to generate adequate returns, with losses being absorbed by outstanding liabilities, ultimately reflecting a state of financial vulnerability and near-insolvency. The reduction of interest-earning capacity to 8%–10% further highlights DFC’s constrained revenue base and diminished competitiveness within the financial market. Unless these structural weaknesses are addressed, the corporation risks long-term erosion of shareholder value and continued deterioration of its financial health. The findings of the study underscore the urgent need for a comprehensive turnaround strategy. Enhancing operational efficiency, reducing NPAs, strengthening credit appraisal mechanisms, diversifying revenue streams and exploring strategic collaborations—such as mergers or partnerships with financially stronger institutions—are critical for restoring the corporation’s long-term viability. Effective loan recovery mechanisms, along with stringent cost control and optimised asset utilisation, will be essential to rebuild financial resilience.
Overall, the study contributes actionable insights that can support DFC in safeguarding its net worth, improving governance practices and re-establishing financial stability. Implementing these recommendations will enable the corporation to reposition itself competitively, better serve its stakeholders and pursue sustainable growth in the future.
Declaration of Conflicting Interests
The authors declared no potential conflicts of interest with respect to the research, authorship and/or publication of this article.
Funding
The authors received no financial support for the research, authorship and/or publication of this article.
ORCID iD
Pooja Singh Negi https://orcid.org/0000-0001-5028-4222
Bhoi, B., & Sahoo, S. (2020). Development finance institutions and regional industrial growth in India. Journal of Economic Development Studies, 12(3), 45–57.
Chattopadhyay, T. (2020). Non-performing assets and financial health of state finance corporations in India. Indian Journal of Finance and Banking, 9(2), 33–48.
Delhi Financial Corporation. (Various years). Annual reports for the years 2019, 2020, 2021, 2022 and 2023 manually collected from the office. https://www.google.com/delhi+financial+corporation; https://www.google.com/search?q=financialanalysis&oq=financial+analysis; https://www.google.com/search?q=ratio+analysis
Few, S. (2012). Show me the numbers: Designing tables and graphs to enlighten (2nd ed.). Analytics Press.
Gopakumar, K. (2005). Financial performance assessment of public sector financial institutions in India. Journal of Financial Management and Analysis, 18(2), 45–58.
Gitman, L. J., & Zutter, C. J. (2018). Principles of managerial finance (15th ed.). Pearson.
Johnston, M. P. (2017). Secondary data analysis: A method of which the time has come. Qualitative and Quantitative Methods in Libraries, 3(3), 619–626.
Kothari, C. R. (2004). Research methodology: Methods and techniques (2nd ed.). New Age International.
Kumar, R., & Joseph, A. (2021). Financial sustainability of state industrial development corporations in India: A comparative analysis. South Asian Journal of Business and Management, 8(1), 72–89.
Mishra, P., & Singh, S. (2020). Inter-firm financial performance analysis: A study of Indian public sector enterprises. Management Review Quarterly, 70(4), 501–518.
Mohan, R. (2021). Evolution and relevance of development finance institutions in India. Economic & Political Weekly, 56(4), 40–48.
Narasimham, S. (2021). Reforming development finance institutions: Issues and policy options. Journal of Public Financial Management, 14(2), 19–34.
Pandey, I. M. (2019). Evaluating financial performance of public financial institutions: A ratio-based perspective. Finance India, 33(1), 101–120.
Rao, K., & Anwar, S. (2020). Financial distress and recovery patterns in state-level financial institutions. Indian Journal of Economics and Development, 16(2), 115–126.
Rawat, D. S. (2017). Accounting ratios and corporate performance: An empirical study of Indian finance corporations. Indian Journal of Accounting, 49(1), 72–84.
Sharma, V., & Bansal, N. (2022). A five-year financial performance assessment of selected Indian financial institutions. International Journal of Accounting Research, 10(1), 84–96.
White, G. I., Sondhi, A. C., & Fried, D. (2003). The analysis and use of financial statements (3rd ed.). Wiley.
Appendix
Table A1. Computation of Financial Ratios of Delhi Financial Corporation and Kerala Financial Corporation for the Last Three Years.
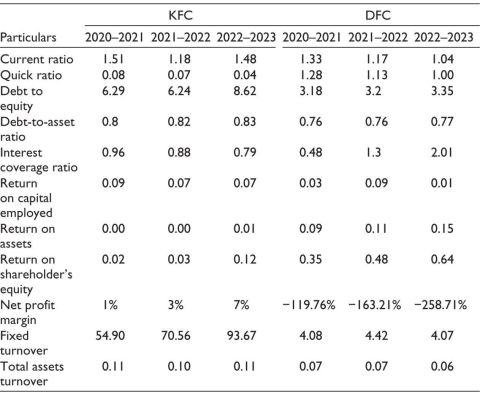
Source: Compiled from DFC Annual Reports (2019–2023) and KFC Official Website Data (2019–2023).
Figure A1. Current Ratio of KFC and DFC.
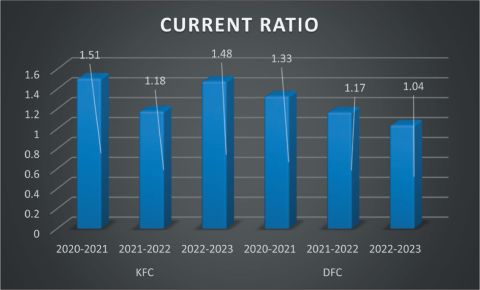
Source: Delhi Financial Corporation Annual Report (2023).
Figure A2. Quick Ratio of KFC and DFC.
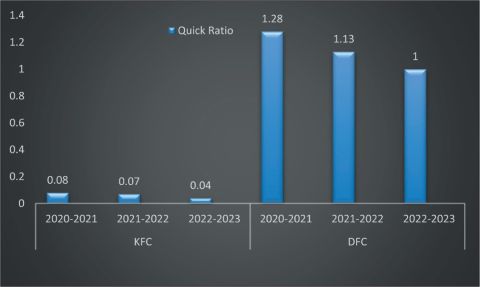
Figure A3. Debt-to-equity Ratio of KFC and DFC.
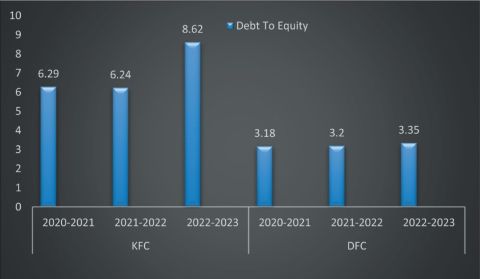
Figure A4. Debt-to-asset Ratio of KFC and DFC.
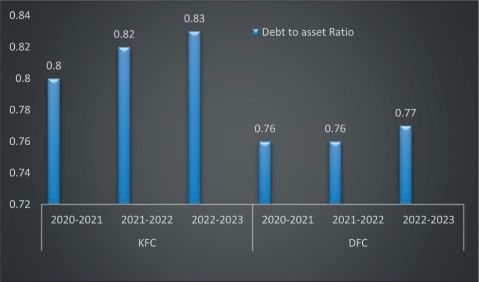
Source: Author’s analysis based on secondary data from DFC and KFC annual reports.
Figure A5. Interest Coverage Ratio of KFC and DFC.
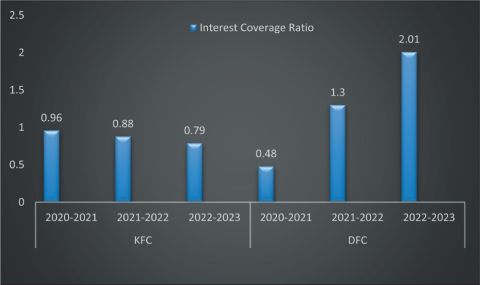
Figure A6. ROCE Ratio of KFC and DFC.
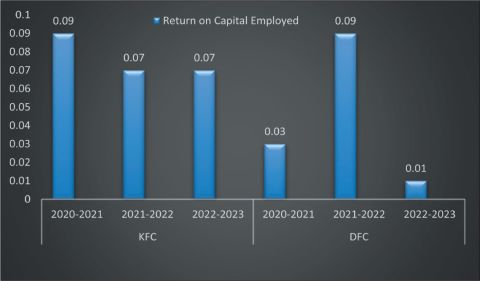
Figure A7. ROCE Ratio of KFC and DFC.
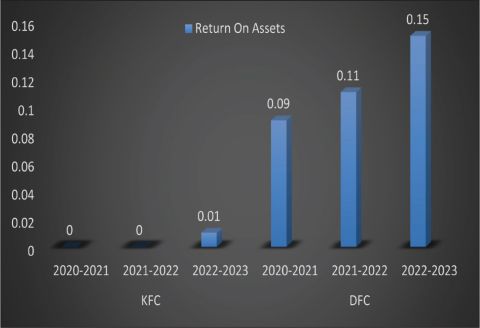
Figure A8. Return on Shareholders’ Equity of KFC and DFC.
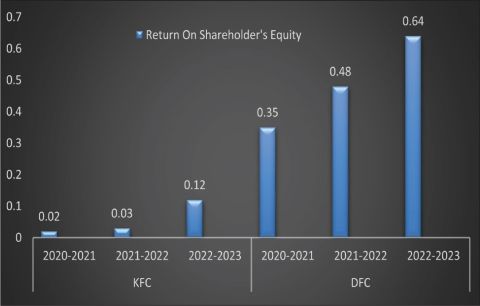
Figure A9. Net Profit of KFC and DFC.
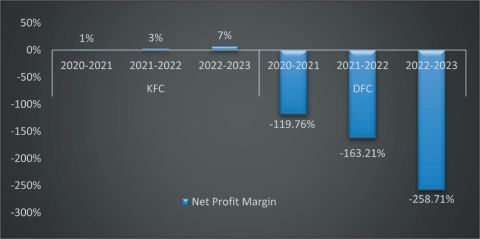
Figure A10. Fixed Assets Turnover of KFC and DFC.
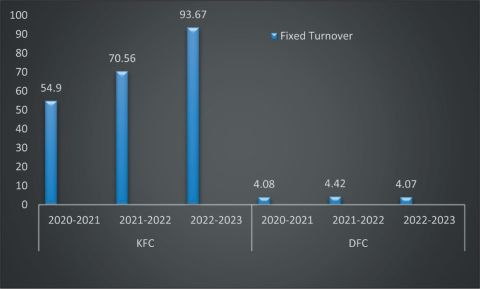
Figure A11. Total Asset Turnover of KFC and DFC.