Review of Professional Management

 Search

1 Humanities and Management Science Department, Madan Mohan Malaviya University of Technology, Gorakhpur, Uttar Pradesh, India

Creative Commons Non Commercial CC BY-NC: This article is distributed under the terms of the Creative Commons Attribution-NonCommercial 4.0 License (http://www.creativecommons.org/licenses/by-nc/4.0/) which permits non-Commercial use, reproduction and distribution of the work without further permission provided the original work is attributed.
Forecasting of stock prices is a very important subject in the financial world and economics. For many years, investors have been interested in making better forecasting models. The autoregressive integrated moving average (ARIMA) model was used previously for time series forecasting. This article shows the process of stock price forecasting using an ARIMA model. Historical stock data for analysis is obtained from the National Stock Exchange (NSE) and is used along with the stock price for forecasting using an ARIMA model. The result obtained from an ARIMA model is better for short-term forecasting and can be proven with existing methods for stock price prediction.
ARIMA model, stock price prediction, stock market, short-term prediction
Introduction
Forecasting is a very important field of study. Researchers in this field always have the desire to perform better than the previously used forecasting techniques. One reason for this is that the investment choices that institutes and individual investors are willing to make require a plan to build an effective model for making future decisions. Forecasting stock prices is regarded as a very complex task to complete in financial forecasting owing to the complex nature of the stock market. Many investors want to create a forecasting model that could enhance their profit as well as minimise the risk of investing in the stock market. For researchers, this is an important factor to consider when changing and developing any required predictive models. For the past few years, many models and processes have been developed for predicting stock market prices. Artificial neural network (ANN) is one among them that is very popular owing to its ability to predict patterns using historical data. Much work has been done using ANNs model for stock price prediction; for example, a hybrid approach was developed to enhance stock price forecasting models by using the desired advantage from each of them.
In the literature, there are two perspectives of prediction: statistical perspective and artificial intelligence perspective. The autoregressive integrated moving average (ARIMA) model is a statistical model perspective. ARIMA model is said to be more powerful in financial time series data forecasting for short-term forecasting as compared to the very popular ANNs model and it is used widely in economics and financial fields.
The ARIMA model was introduced by Box and Jenkins in 1970. It is also referred to as Box-Jenkins’s methodology. It is a set of processes to identify, estimate and diagnose ARIMA technique for time series data. ARIMA models are efficient for short-term forecasting. It also performs better than most complex structural models for short-time prediction. Future value in ARIMA is the value of a variable, and it is the linear summation of past values and past errors, which is expressed as follows:

Here, Yt is the actual value and t ε is the random error at t; φi and θj are the coefficients, and p and q are integers, which are often referred to as autoregressive and moving average, respectively.
Building an ARIMA predictive model consists of many steps, which are identification of model, estimation of parameter and checking of diagnostic.
Objective
In the present scenario, investment in financial markets is very important for the growth of the economy. Limited analysis of an investment can result in loss. Currently, investors mainly focus on the fundamental data of the company for making an investment. So the objective of this study is to forecast stock prices for the Indian market in order to make better investment decisions.
Literature Review
Nayak et al. (2016) in the paper titled ‘Prediction models for Indian stock market’ stated that, for the past few years, many people have been showing interest in investing in the stock market. When investing, the investor may lose all the money they invested. For this reason, an efficient predictive model is required to understand the future behaviour of the stock market. Many forecasting models have been developed about the market trend but very few give good results.
Babai et al. (2011) in the paper titled ‘Forecasting and inventory performance in a two-stages supply chain with ARIMA (0,1,1) demand’ stated that the demand model for ARIMA (0,1,1) was analysed extensively by researchers. Forecasting practitioners use ARIMA widely, as it has promising theoretical features. They analyse the correlation between the accuracy of forecasting and the performance of the inventory in order to investigate if there are any benefits of sharing the forecast data with retailers and manufacturers.
Ertekin and Büyükahin (2019) in the paper titled ‘Improving forecasting accuracy of time series data using a new ARIMA-ANN hybrid method’ stated that it is important to forecast time series data as it is also a very challenging task. It is used in a lot of other fields of application. Studies have been done on linear data individually or in a combination with non-linear data. To forecast stationary time series data, a linear model like ARIMA has a good forecasting accuracy.
The past studies also classify forecasting models according to their perspective: statistical approach and artificial intelligence approaches. An ARIMA model relates to the statistical perspective (Wang et al., 2012). It is considered as being efficient as well as predominant for time series forecasting. Many researchers showed that the short-term predictions of ARIMA technique perform better than those of ANNs models (Lee et al., 2007; Merh et al., 2010; Sterba & Hilovska, 2010).
Adebiyi et al. (2014) in their study demonstrated the ability of an ARIMA model to provide relatively accurate short-term predictions about stock prices. Among the works that applied ARIMA for forecasting purposes are Contreras et al. (2002), Khashei et al. (2012), Wang (2011), and Lee and Ko (2011).
The time series methods can be divided into two types. The first, that is, the univariate method, is applied using only a time series of the examined variable, in contrast to the second, the multivariate method, which in addition requires time series of related variables. The main advantage of an ARIMA model being a univariate method is that it requires less data than a multivariable approach. This feature makes an ARIMA model convenient for forecasting the stock prices of many stocks. One time series also allows avoiding inconsistent data, which is a problem that multivariate models may suffer if the available time lengths of time series are not matched or have missing observations. The main disadvantage of an ARIMA model is that it is based on historical information; therefore, it is not capable of predicting shocks or big, unexpected changes in the stock price (Meyler et al., 1998).
Methodology
The detailed process for an ARIMA model is explained further. The tool used for implementation of model is Python. Historical daily stock data collected from the National Stock Exchange (NSE) is used in this research work. The stock data has four constituents, which are open, low, high and close price. Closing price is used in this research. It was selected because it shows all the events that happened on that particular trading day. Several experiments were performed to examine the best ARIMA model, and the following methodology was used.
Research Framework
The study is based on the stock price of the company and the forecasting of the stock price.
Research Design
The research design shows the methods and procedures for conducting any particular study. The objective of the analytical research design applied here is to analyse and forecast the stock price of Maruti Suzuki.
Method of Data Collection
Secondary data is used to reach the aims and objectives of this project. The secondary data for the analysis, which is the stock data for the past 4 years, was collected in digital form from the NSE website. I had chosen these sources because of the reliability and suitability of these sources, and I was also sure about the accuracy of the data.
Research Instrument
The research instrument used for the study is the daily closing price of the stock price of Maruti Suzuki.
Data Analysis
ARIMA is a tool that is used to forecast stationary time series data.
An ARIMA (p, d, q) model requires three input parameters:
• p is used for autoregressive.
• d is used for to make the time series data stationary.
• q is used for moving average.
ARIMA is able forecast stationary time series data.
What does stationarity mean
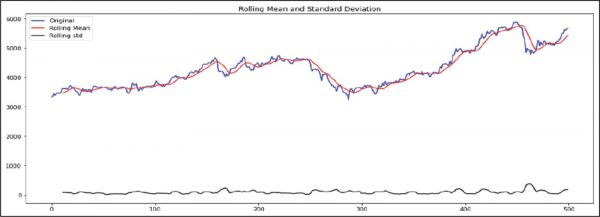
A time series data is considered to be stationary when the mean and standard deviation remain constant over time. In order to check the stationarity of data, the rolling mean and standard deviation are computed and plotted on the original time series data.
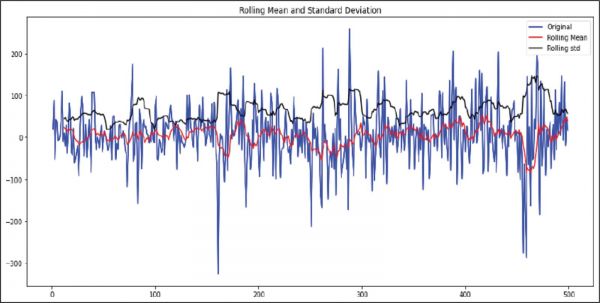
It is evident from the graph in Figure 2 that the mean and standard deviation in not constant over time. So the data needs to be made stationary. To do that, the first-order difference of the data was taken. In simple words, subtract today’s price from yesterday’s price and plot it again (Figure 3).
Figure 1. Graph of Collected Data
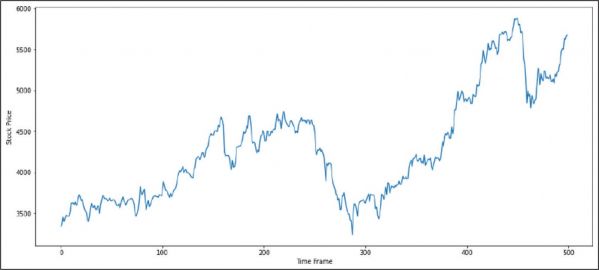
Figure 2. Mean, Standard Deviation and Original Data
From the graph in Figure 3, it is evident that mean and standard deviation remain constant. Since stationarity is achieved by differencing once, the d term for ARIMA will be 1.
Figure 3. Mean, Standard Deviation and Differenced Data
Autocorrelation (ACF) and stands for partial autocorrelation (PACF) plots are usually used for stock price analysis and forecasting.
They show how strong or weak the relationship of an observation in a time series is with the observations at prior time steps.
Autocorrelation is the relation between points at time t (Pt ) and the point at (Pt–1). Partial autocorrelation is the relation between point at time t (Pt ) and the point (Pt–k) where k is any number of lags. Partial autocorrelation ignores all of the data in between both these points.
In simple words, autocorrelation is the relationship between today’s stock price and yesterday’s stock price. Partial autocorrelation shows the relationship between today’s stock price and the price it was a week before. Let’s obtain the plots for autocorrelation and partial autocorrelation.
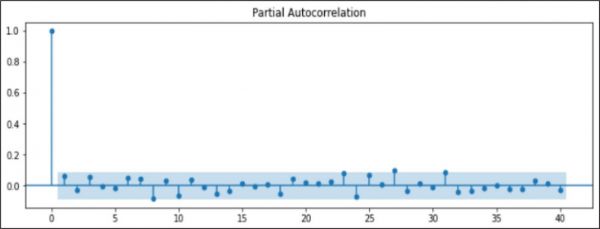
The p term for ARIMA is computed from the autocorrelation plot (Figure 4). The p term is taken as that which crosses the significance zone. So the p term is 8.
The q term for ARIMA is computed from the partial autocorrelation plot (Figure 5). The q term is taken as that which crosses the significance zone. So the q term is 8.
Figure 4. Auto Correlation Plot
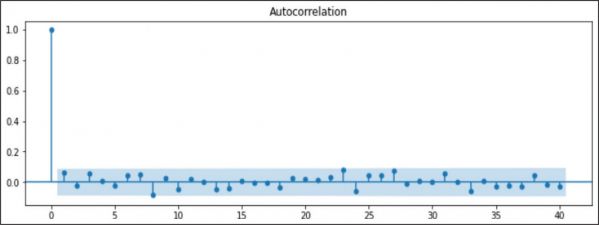
Figure 5. Partial Auto Correlation Plot
Result and Conclusion
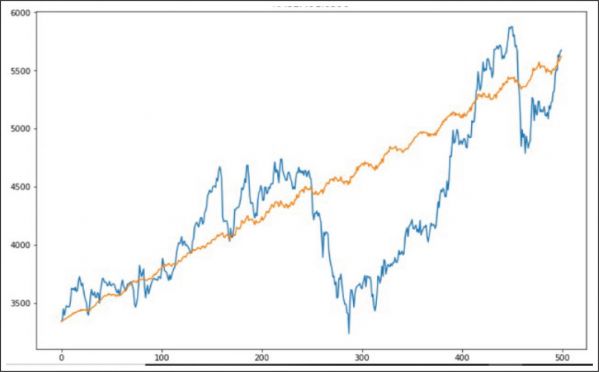
For ARIMA (p,d,q) model, the values obtained are p = 8, d = 1 and q = 8. So the model is fitted for ARIMA (8,1,8). The result obtained is shown in Table 1 and plotted in Figure 6.
Table 1. Original and Forecasted Data
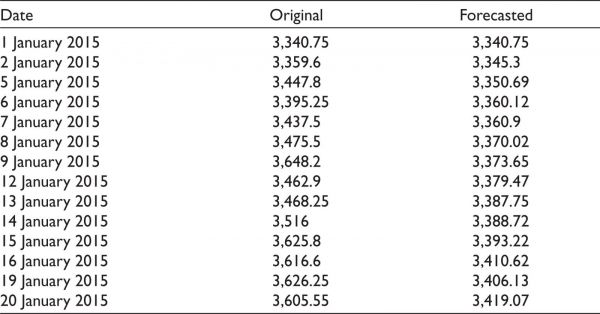
Figure 6. Original Data and Forecasted Data
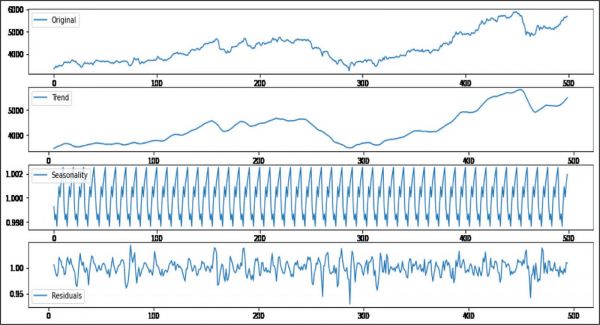
The original time series data is decomposed and plotted in Figure 7. It contains trend, seasonality and the residual part of the original time series data. By comparing them with the forecasted result, it is evident that the forecasted result contains the trend and seasonality part of the time series data, but it does not contain mush of the residual part of the original time series data.
Figure 7. Decomposition of Original Time Series Data
To check the statistical accuracy of the forecasted result, the Root Mean Square Error (RMSE) and Mean Absolute Percentage Error (MAPE) are computed. The value of RMSE is 492.4 and of MAPE is 8.92%, which is pretty good. A MAPE of 8.92% indicates that our model is 91.08% accurate.
An analysis of Maruti Suzuki stock price for the previous 5 years daily traded value on the NSE gives us an ARIMA (8,1,8) model. ARIMA (8,1,8) is used in predicting the future values of Maruti Suzuki stock price. An ARIMA (8,1,8) model was selected as it satisfies all criteria of the statistics fit.
This article explored the wide process of making an ARIMA model to forecast the stock price of Maruti Suzuki. The obtained experimental results show the potential of ARIMA model—that it could be helpful for making profitable investment decisions.
Limitation
There are some limitations in using an ARIMA model to forecast time series data. This technique produces the desired results only for a short time period. When a sudden change in the data happens, such as when a government changes its policy or there is economic instability (a structural break), in that case, it is hard for the model to capture the change; so this model is not good to forecast for longer periods of time. Forecasting with this model assumes that the time series data is linear.
Future Scope
Forecasting of stock price was done using an ARIMA model. The assumption for using ARIMA is that time series data is linear, and so implementing non-linear forecasting techniques using soft computing techniques can be considered with a lesser white noise term.
Declaration of Conflicting Interests
The authors declared no potential conflicts of interest with respect to the research, authorship and/or publication of this article.
Funding
The authors received no financial support for the research, authorship and/or publication of this article.
Adebiyi, A. A., Adewumi, A., & Ayo, C. (2014). Comparison of ARIMA and artificial neural networks models for stock price prediction. Journal of Applied Mathematics, 2014, 1?7.
Babai, M. Z., Ali, M. M., Boylan, J. E., & Syntetos, A. A. (2013). Forecasting and inventory performance in a two-stages supply chain with ARIMA (0,1,1) demand. Production Economics, 143, 463?471
Contreras, J., Espinola, R., Nogales, F., & Conejo, A. J. (2002). ARIMA models to predict next-day electricity prices. IEEE Transactions on Power Systems, 18(3).
Ertekin, S., & Büyükahin, Ü. Ç. (2019). Improving forecasting accuracy of time series data using a new ARIMA-ANN hybrid method. Neurocomputing, 361, 151?163.
Khashei, M., Bijari, M., & Ardal, G. A. R. (2012). Hybridization of autoregressive integrated moving average (ARIMA) with probabilistic neural networks. Computers and Industrial Engineering, 63(1), 37?45.
Lee, C., & Ko, C. (2011). Short-term load forecasting using lifting scheme and ARIMA model. Expert System with Applications, 38(5), 5902?5911.
Lee, K., Sehwan, Y., & Jin, J. J. (2007). Neural network model vs. SARIMA model in forecasting Korean stock price index (KOSPI). Issues in Information Systems, VIII(2).
Merh, N., Saxena, V. P., & Pardasani, K. R. (2010). A comparison between hybrid approaches of ANN and ARIMA for Indian stock trend forecasting.
Meyler, A., Kenny, G., & Quinn, T. (1998). Forecasting Irish Inflation using ARIMA Models. Paper presented at Central Bank of Ireland Research Department.
Nayak, A., Pai, M. M. M., & Pai, R. M. (2016). Prediction models for Indian stock market. Procedia Computer Science, 89, 441 ?449.
Sterba, J., & Hilovska. (2010). The implementation of hybrid ARIMA neural network prediction model for aggregate water consumption prediction. Journal of Applied Mathematics, 3(3), 123?131.
Wang, C. (2011). A comparison study of between fuzzy time series model and ARIMA model for forecasting Taiwan export. Expert System with Applications, 38(8), 9296?9304.
Wang, J. J., Wang, J. Z., Zhang, Z. G., & Guo, S.P. (2012). Stock index forecasting based on a hybrid model. Omega, 40, 758?766.
